
Open any B2B CRM and the closed-lost field will tell you a tidy story: lost to price, lost to a competitor, lost to budget.
The story is clean, confident, and wrong most of the time, because the person filling in that field was looking at the deal from the one seat that could not see why it died.
We run competitors’ full evaluation as a real buyer, on your behalf, which puts us in the one seat a seller never gets: the buyer’s side of the decision, where the real reasons a deal is won or lost come from.
We collected the most useful, independently verified SaaS win/loss statistics we could source, from large pipeline datasets and buyer-interview studies. Each number is footnoted to the study behind it.
The short version: win rates are falling, the reason on the CRM card is usually fiction, and the companies that go ask the buyer what really happened win measurably more.
If you only keep a handful of these, keep these:
Cold Outreach Was Never a Coin Flip
Before diagnosing any single loss, look at the base rate, because it sets the odds every deal is fighting from the start.
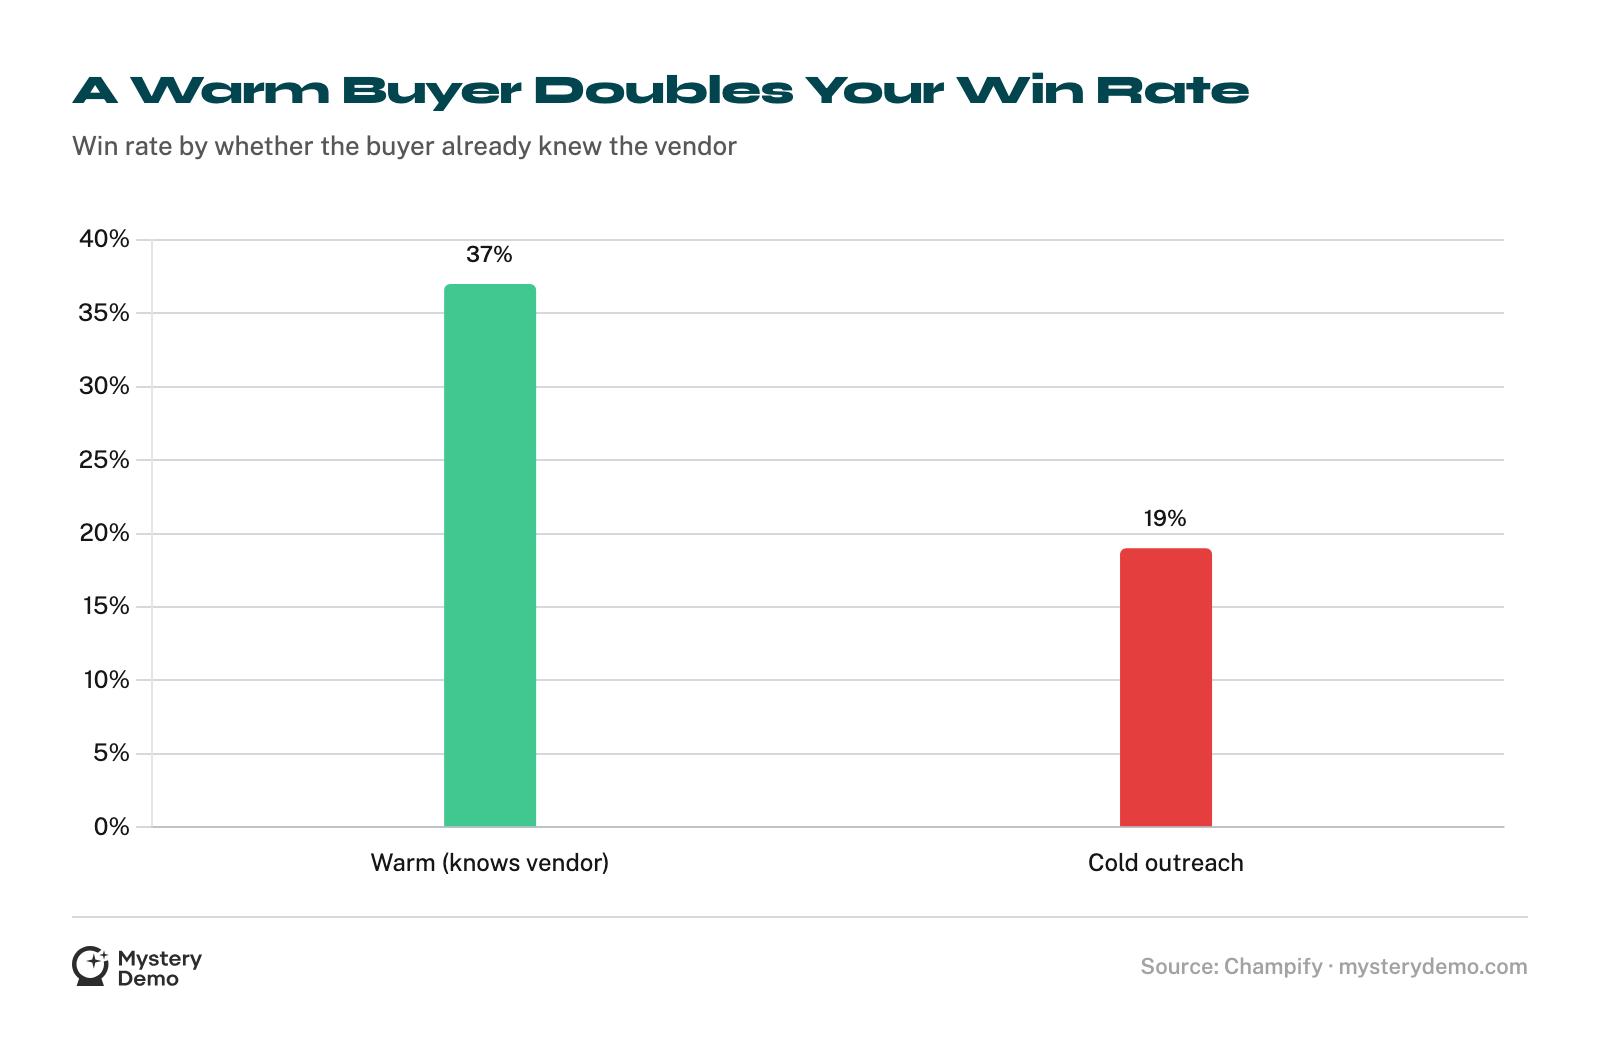
A 19% cold-outbound win rate means losing four deals out of five as a matter of routine, and it has been getting worse: a 27% drop in win rate since 2021 separates a team that hits plan from one that quietly misses it all year.
The deeper point hides in the first number. The gap between 37% and 19% is the gap between a buyer who walks in already trusting you and one who does not.
That means a large share of whether you win is decided before the first call. The loss was often baked in long before the rep who logged it ever got involved.
Price Is Almost Never the Real Reason
When a deal does die, the rep reaches for price the way a latecomer blames traffic. It is available, it is nobody’s fault, and it is usually not what happened.
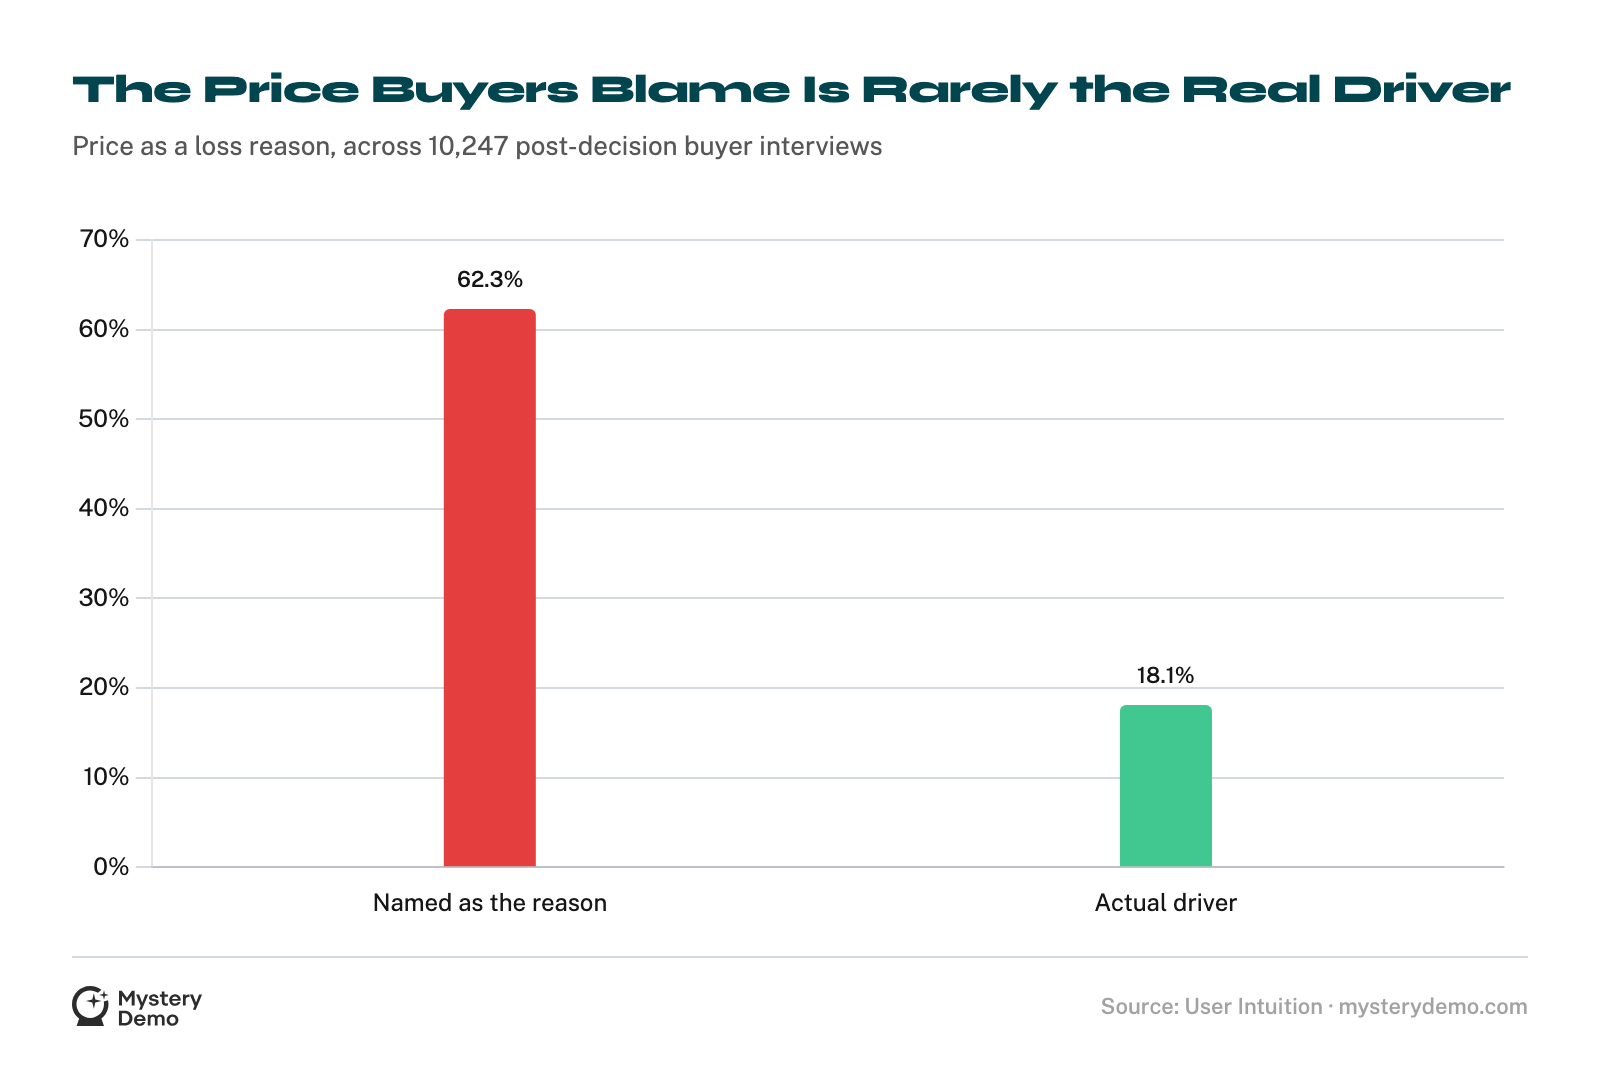
The bigger the deal, the bigger the gap, which sounds backwards until you see what price is standing in for. On a large purchase, “too expensive” is rarely about the number on the quote.
It is shorthand for a buyer afraid the rollout will fail, whose champion lost a fight internally, or who could not picture getting value fast enough to justify the spend.
Price is the polite reason a buyer gives so they do not have to explain the real one. A seller who takes it at face value cuts margin to solve a problem that was never about cost.

Your CRM Loss Reasons Are Mostly Wrong
If the reasons buyers state are unreliable, the reasons sellers log are worse, because the seller is guessing about a decision they never watched happen.
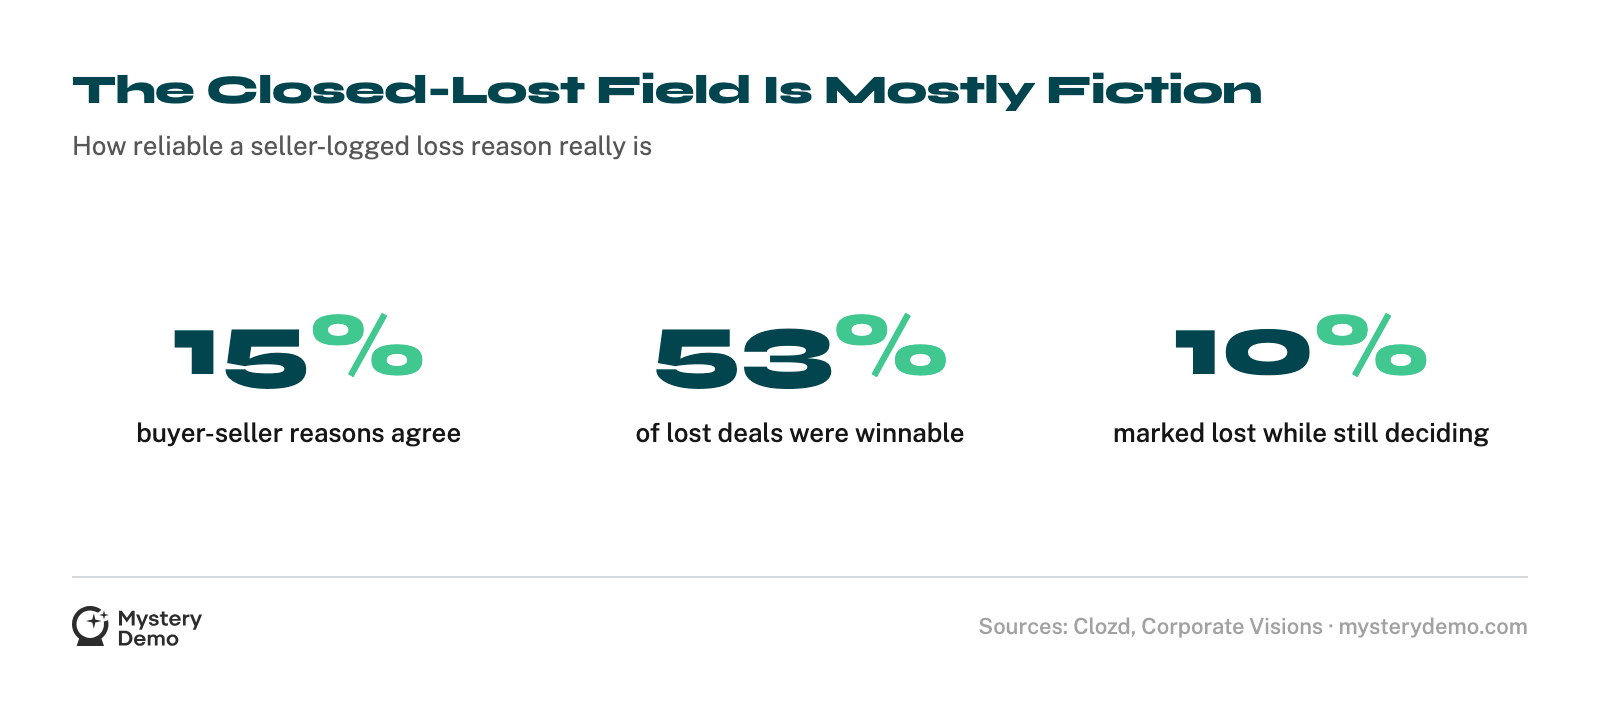
Read those together and the closed-lost field starts to look like fiction with a confidence interval. A reason that matches the buyer 15% of the time is barely better than guessing, and the 10% of deals written off while the buyer was still shopping means some pipeline is being killed by the seller’s own paperwork.
The reason is structural: the seller is not in the room for the part that decides the deal. They see the demo, the emails, the negotiation. They do not see the internal debate, the competitor’s counter, the moment the champion gives up.
.png)

Win-Loss Programs Move the Number
The fix for all of this is unglamorous and well-proven: go ask the buyer what really happened, in a structured way, every time. The companies that do it see it in the win rate.
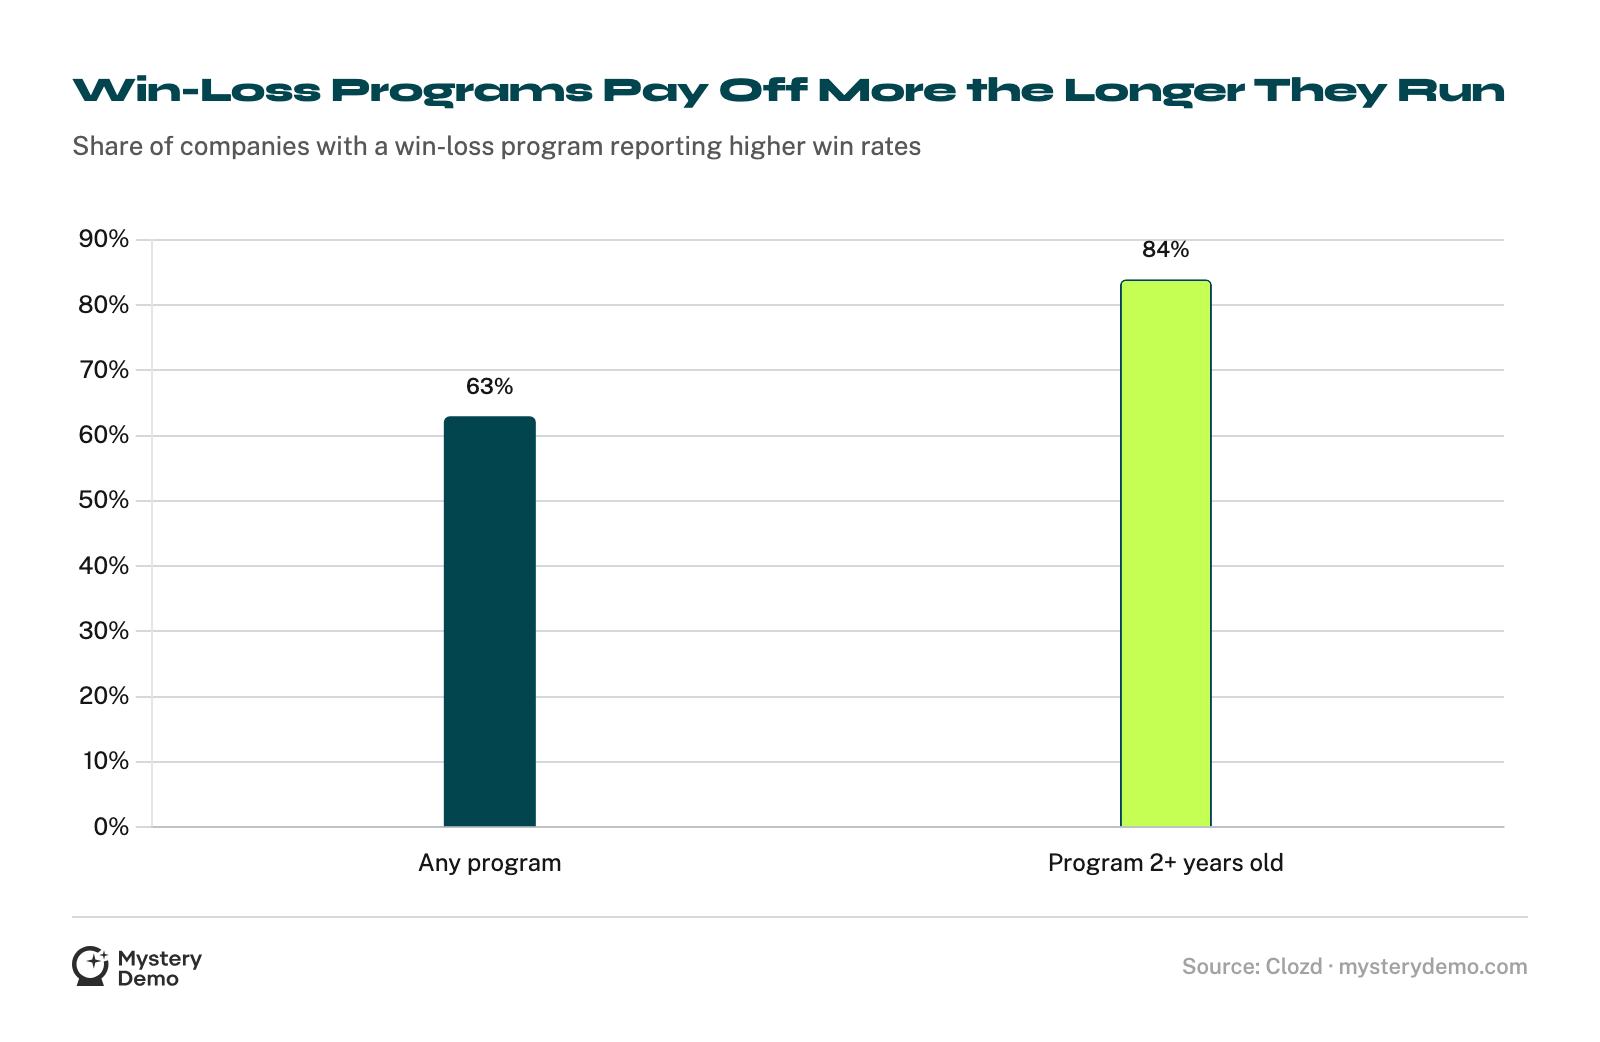
The 84%-at-two-years figure is the one that rewards patience. Win-loss pays off when it runs every quarter, because the patterns compound, and a single report commissioned after a bad quarter captures almost none of that.
The 97% retention number points the same way: almost everyone who runs a real program keeps paying for it.
The mechanism is simple: you cannot fix a loss you have misdiagnosed, so the most valuable move in sales is to replace the reason you guessed with the reason the buyer gives.
Most Programs Are Built to Miss
The catch is that doing win-loss and doing it well are different things, and most companies are still on the wrong side of that line.
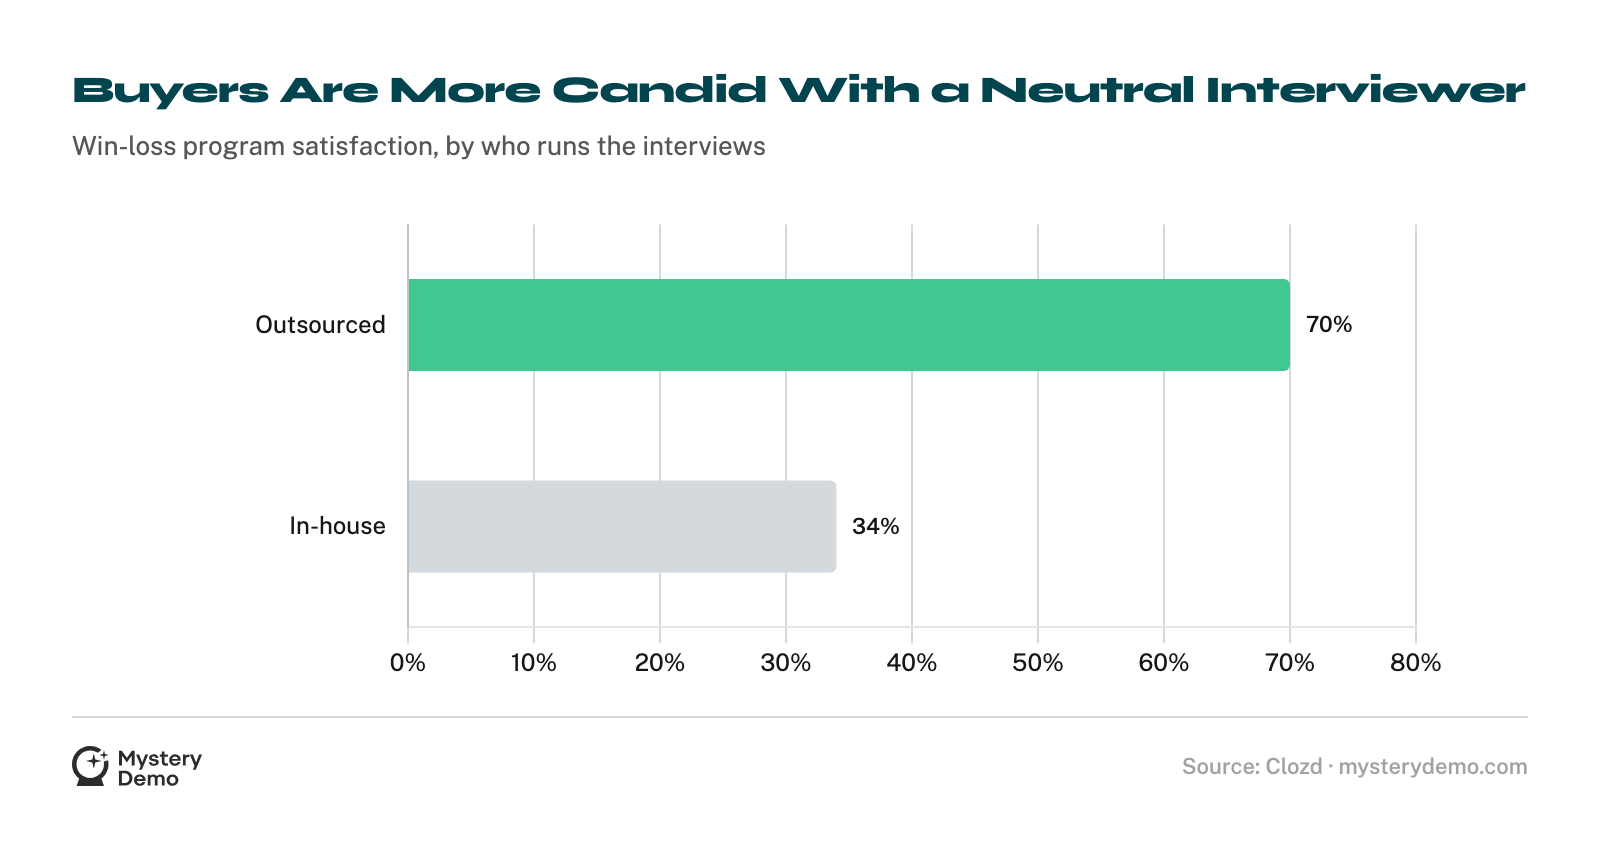
The satisfaction gap between outsourced and in-house programs, 70% against 34%, comes down to candor. A lost buyer will tell a neutral third party things they will never say to the rep who just lost their deal, which is why the company that asks gets the truth and the company that guesses gets price.
The same logic runs through every number on this page: the real reason a deal is won or lost is visible only from the buyer’s seat, and the teams that win more found a way to sit there.
That is the work we do, one competitor at a time. Running a rival’s evaluation as a buyer puts us inside the loss as it happens: where their demo loses the room, where their price stops feeling worth it, where their champion would quietly give up.
It is the layer your own win-loss program can never reach, because your reps will never be the buyer inside your competitor’s deal. A competitor product comparison built on real buyer evidence is where it surfaces.
The buyers who chose a competitor and never called back are the interview you need most, and the one you can never run. We’ll take the buyer’s seat instead and tell you what they heard that you did not.
Frequently Asked Questions
What is the average B2B SaaS win rate?
It depends on how warm the lead is. Cold-outbound deals close at about 19%, while deals where the buyer already knows the vendor close at 37%1.
Are B2B win rates getting worse?
Yes. As budgets tightened, win rates fell 18% versus 2022 and 27% versus 20212, and a brief 7% recovery in early 2023 did not hold2.
What is the most common reason B2B deals are lost?
Buyers say price, but they are usually wrong. Price is named in 62% of lost deals yet is the actual driver in only 18%4.
Is price really why you lose deals?
Rarely. On deals over $1M, about 68% of buyers blame price, but it drives fewer than 10% of decisions4; it usually stands in for implementation risk or lost champion confidence.
If not price, why do B2B deals get lost?
Five hidden drivers explain most losses: implementation risk (24%), champion confidence (21%), time-to-value anxiety (17%), a narrative gap (11%), and a credibility gap (9%)4.
How accurate are CRM loss reasons?
Not very. Buyer and seller reasons for a lost deal agree only 15% of the time, leaving 85% of CRM loss data unreliable on its own5.
How often do sellers and buyers disagree on why a deal was lost?
Most of the time. Across 100,000 purchase decisions, sellers and buyers gave different loss reasons 50 to 70% of the time7.
How many lost deals were winnable?
More than half. 53% of buyers say the deal was winnable, undone by a fixable misstep during the process7.
Do reps ever mark deals lost too early?
Yes. In 10% of deals marked lost, the buyer was still actively considering their options7.
Why are seller-reported loss reasons so unreliable?
Because the seller is not present for the decision. They see the demo and the negotiation but not the internal debate, so a logged loss reason is a reconstruction of a decision the rep never watched.
What is win-loss analysis?
It is the practice of interviewing buyers after a deal closes to learn why they really chose or rejected you. 83% of companies now practice some form of it, up from 79% in 20208.
Does win-loss analysis improve win rates?
Yes. 63% of companies with a program report higher win rates, rising to 84% for programs running more than two years6.
What is the ROI of a win-loss program?
High enough that almost nobody stops. 97% plan to maintain or increase their investment6, and Gartner found comprehensive programs drive up to a 50% win-rate improvement and a 15 to 30% revenue increase9.
How long before a win-loss program pays off?
It compounds. The share of companies reporting higher win rates climbs from 63% to 84% once a program passes two years6.
What share of companies run a mature win-loss program?
A minority. Only 39% run the ongoing, cross-functional kind, and those are 53% more likely to report a strong return6.
Should you run win-loss interviews in-house or outsource them?
A third party gets better answers. 44% now outsource, and those programs reach 70% satisfaction against 34% for in-house6, because buyers are more candid with a neutral interviewer.
Why are buyers more honest with a third party?
Because there is no relationship to protect. A lost buyer will tell a neutral interviewer things they would never say to the rep who just lost their deal, which is why outsourced programs report far higher feedback quality6.
How does competitor research relate to win-loss analysis?
Your own win-loss program studies your deals. Studying a competitor’s deals as the actual prospect shows why they win, a vantage point a seller can never get on their own rival, and what we capture for you, one deal at a time.
References
- Champify: 2025 Impact Report (2025)
- Ebsta and Pavilion: 2024 B2B Sales Benchmarks (2024)
- Ebsta and Pavilion: 2025 GTM Benchmarks (2025)
- User Intuition: Why Price Is Almost Never the Real Reason You Lost the Deal (2026)
- Clozd: The Ultimate Guide to Win-Loss Analysis (2026)
- Clozd: 2025 State of Win-Loss Analysis Report (2025)
- Corporate Visions: What Is Win-Loss Analysis? (2026)
- Clozd and Pragmatic Institute: 2023 State of Win-Loss Analysis Report (2023)
- Gartner: Tech Go-to-Market, Win-Loss Analysis to Increase Win Rates and Revenue (2014)
.png)


