
The average B2B SaaS sales cycle is a number that describes almost no real deal. It is the midpoint between a $2,000 self-serve sign-up that closes in a fortnight and a seven-figure enterprise deal that drags through procurement for a year.
Quote the average and you have described neither.
We run competitors’ full sales process as a real buyer, on your behalf, and time every stage of it: the ones that close us in a week, and the ones that go quiet for a month while a rival waits on a sign-off we never get to see.
We collected the most useful, independently verified SaaS sales cycle statistics we could source, from large pipeline datasets and benchmark studies. Each number is footnoted to the study behind it.
The short version: cycle length scales with deal size less reliably than you would think, deals have been getting slower for years, and the channel that sources a deal predicts its speed as much as anything else.
If you only keep a handful of these, keep these:
There Is No Single Cycle Length
Read cycle length as a function of deal size, not as one number. The bigger the contract, the more people, gates, and sign-offs sit between hello and signature.
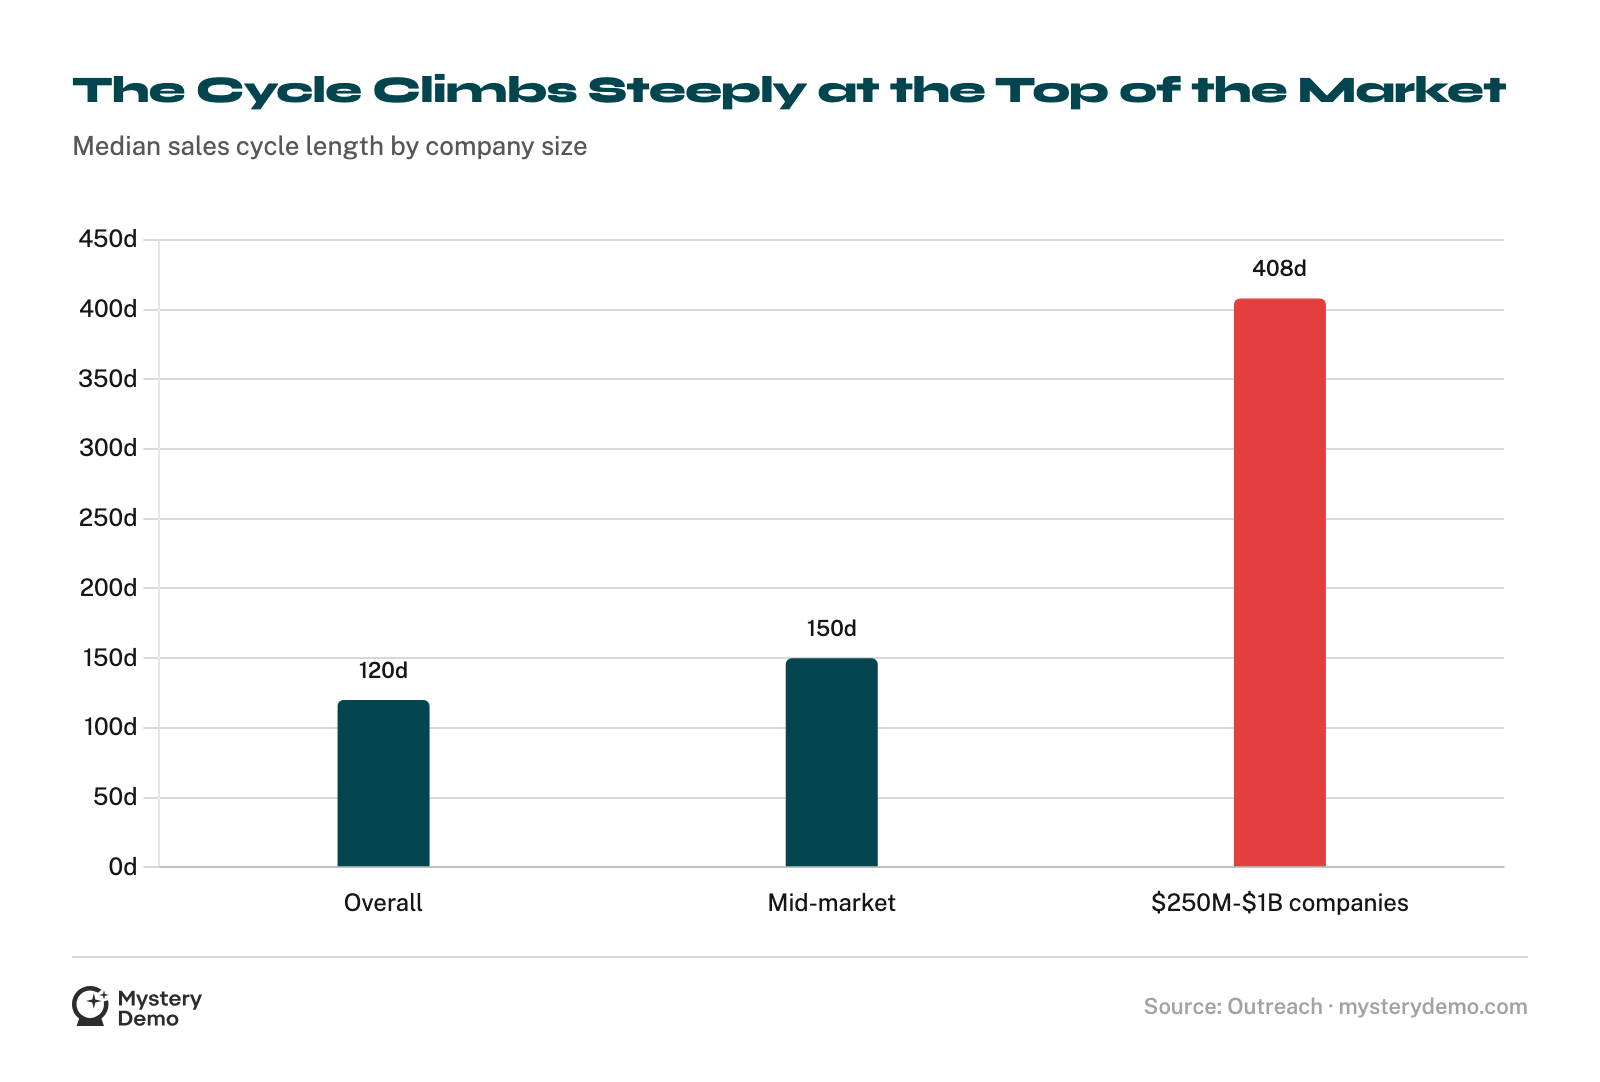
The practitioner ladders and the measured day-bands agree on the shape: cycle length climbs with ACV, and it climbs steeply at the top.
The 408-day figure is the one to sit with. It puts a number on what every enterprise rep knows in their bones, that a deal at a giant company is measured in seasons.
The 3% rule is the other half of the lesson: a deal that runs long past its expected window has usually already lost. When we walk a competitor’s enterprise motion, we watch how quickly they clear a deal that is not going to close.
Bigger Is Not Always Slower
A regression across 54 B2B SaaS companies tested the assumption that a bigger deal always means a longer cycle, and it only half holds up. Cycle length explained just 26.8% of the variance in deal size, so the two are only loosely linked5.
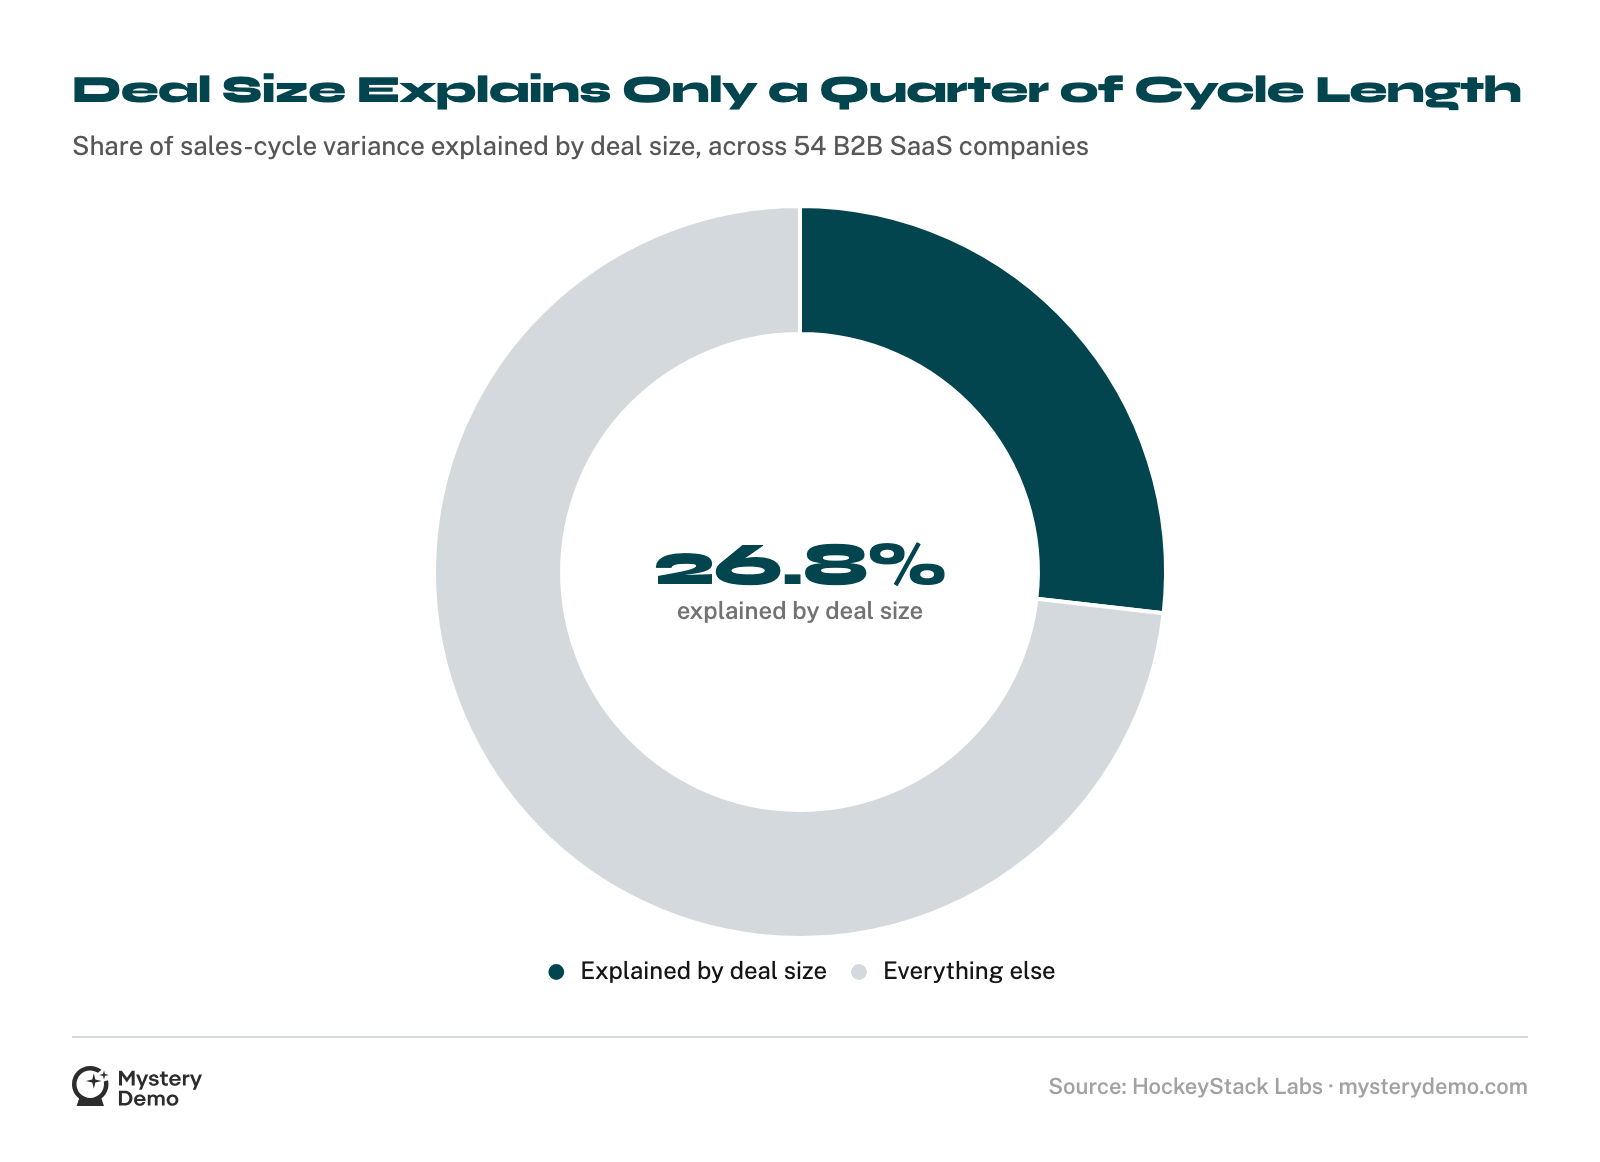
Three-quarters of why one deal takes longer than another has nothing to do with its price tag. When a deal crawls, the instinct is to shrug and say it is a big one.
The data says look elsewhere: at the number of stakeholders, the complexity of the product, the legal and security review, the buyer’s own internal chaos. The structure of the buying group predicts cycle length far better than the price does.
A simple six-figure renewal can close faster than a messy $30,000 first purchase with seven people in the room. The number that matters is the count of people who have to say yes, and it is nowhere on the contract.

The Cycle Has Been Getting Longer
The slowdown that started in 2022 did not reverse; across every measure below, it settled in as the new baseline.
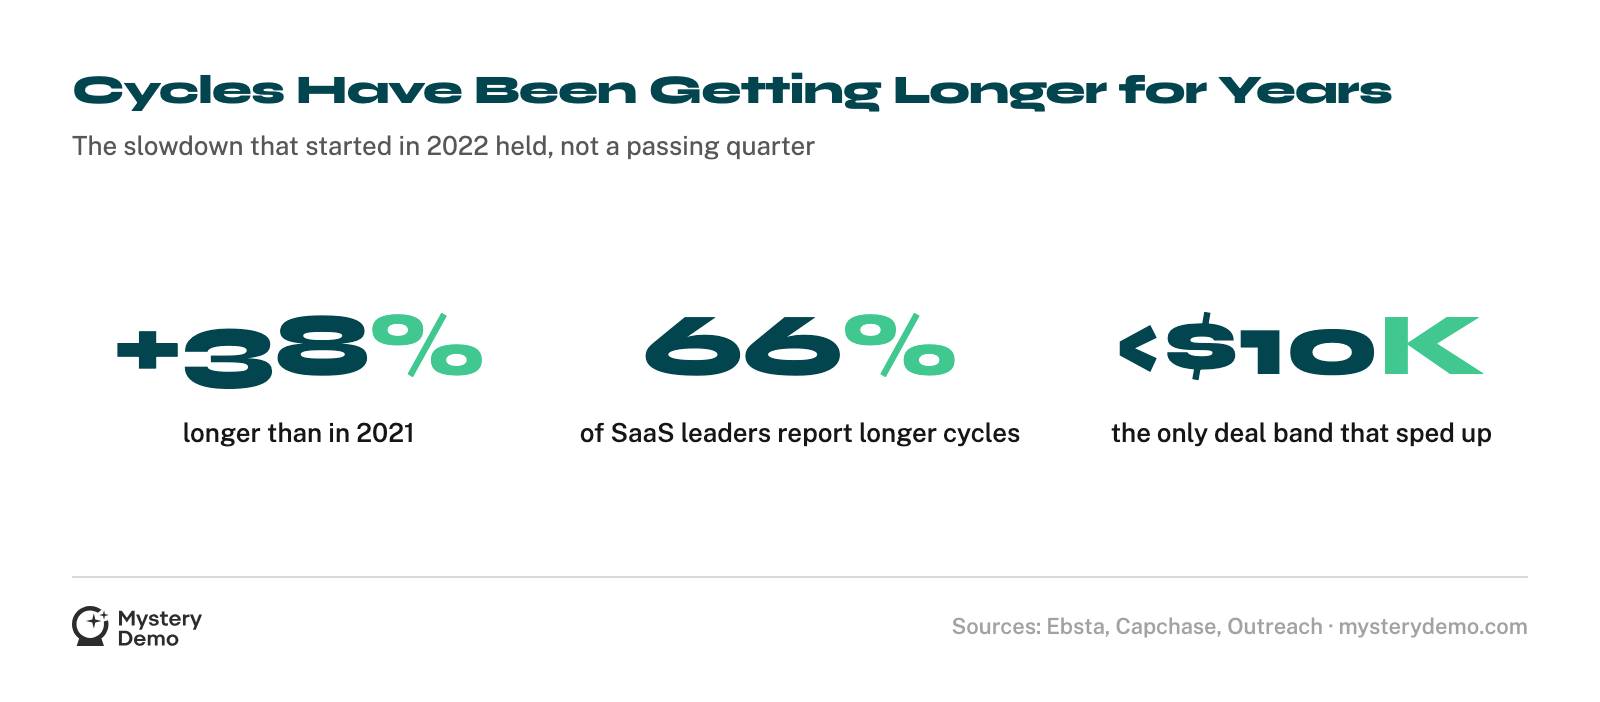
The last point is the sharpest. When only the smallest, simplest deals are getting faster and everything else is slowing, the slowdown is coming from the buying environment rather than the pitch: more caution, more scrutiny, more people asked to justify the spend.
The lengthening held for years, not quarters, so this is not a downturn artifact waiting to unwind. Longer is the new normal, and a sales motion built for the speed of 2021 is now out of step with how the same buyer purchases today.
The Channel Sets the Speed Before the First Call
If deal size is a weak predictor of speed, the channel that sourced the deal is a strong one. The gap between the fastest and slowest source runs to an order of magnitude.
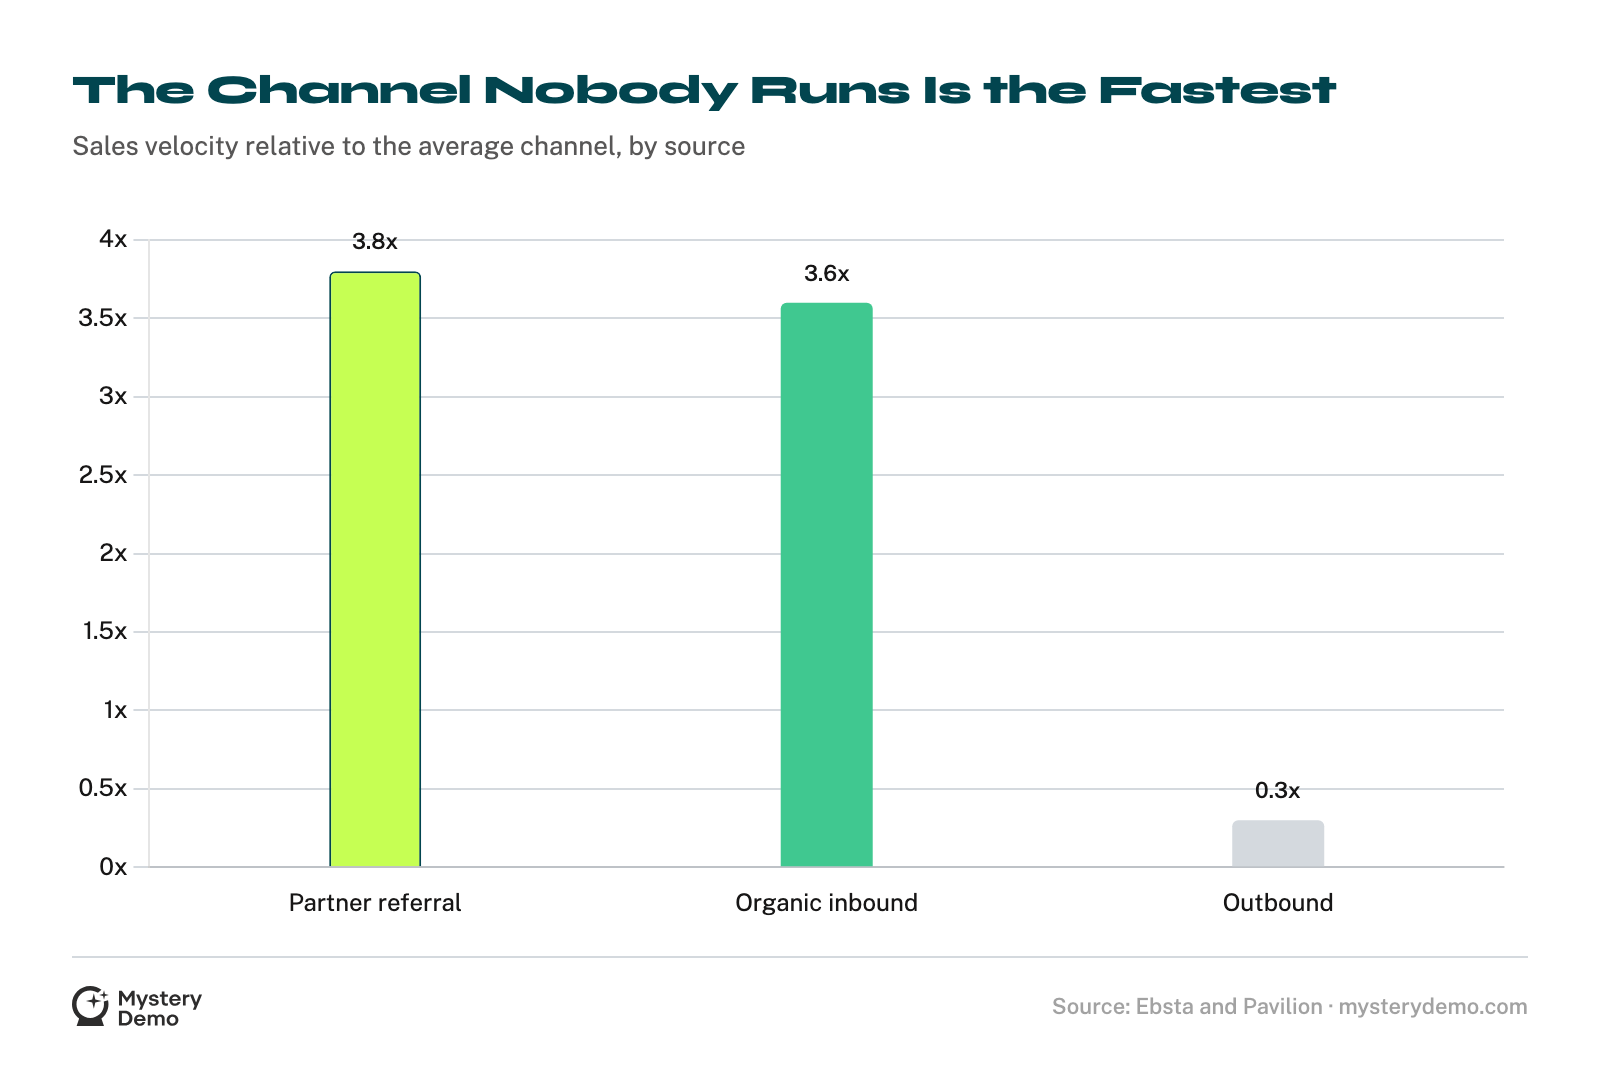
The headline is uncomfortable for most go-to-market teams: the channel they pour the most into, outbound, is the slowest by a wide margin, and the fastest one, partner referral, is the one almost nobody runs.
Outbound still wins for smaller companies with bigger deals, so abandoning it would be a mistake. But cycle length is partly a sourcing decision, set months before a rep gets anyone on the phone.
A deal that arrives warm is already halfway through the trust-building a cold outbound deal has to do from scratch.
When we study how a competitor sells, the channel mix behind their pipeline tells us how fast their average deal can possibly move before we even see a demo.
Reading that mix is part of what a competitor sales-tactics review turns up.
.png)
Why the Enterprise Deal Crawls
All of this concentrates at the top of the market, where the cycle turns into an approval problem the rep cannot solve alone.
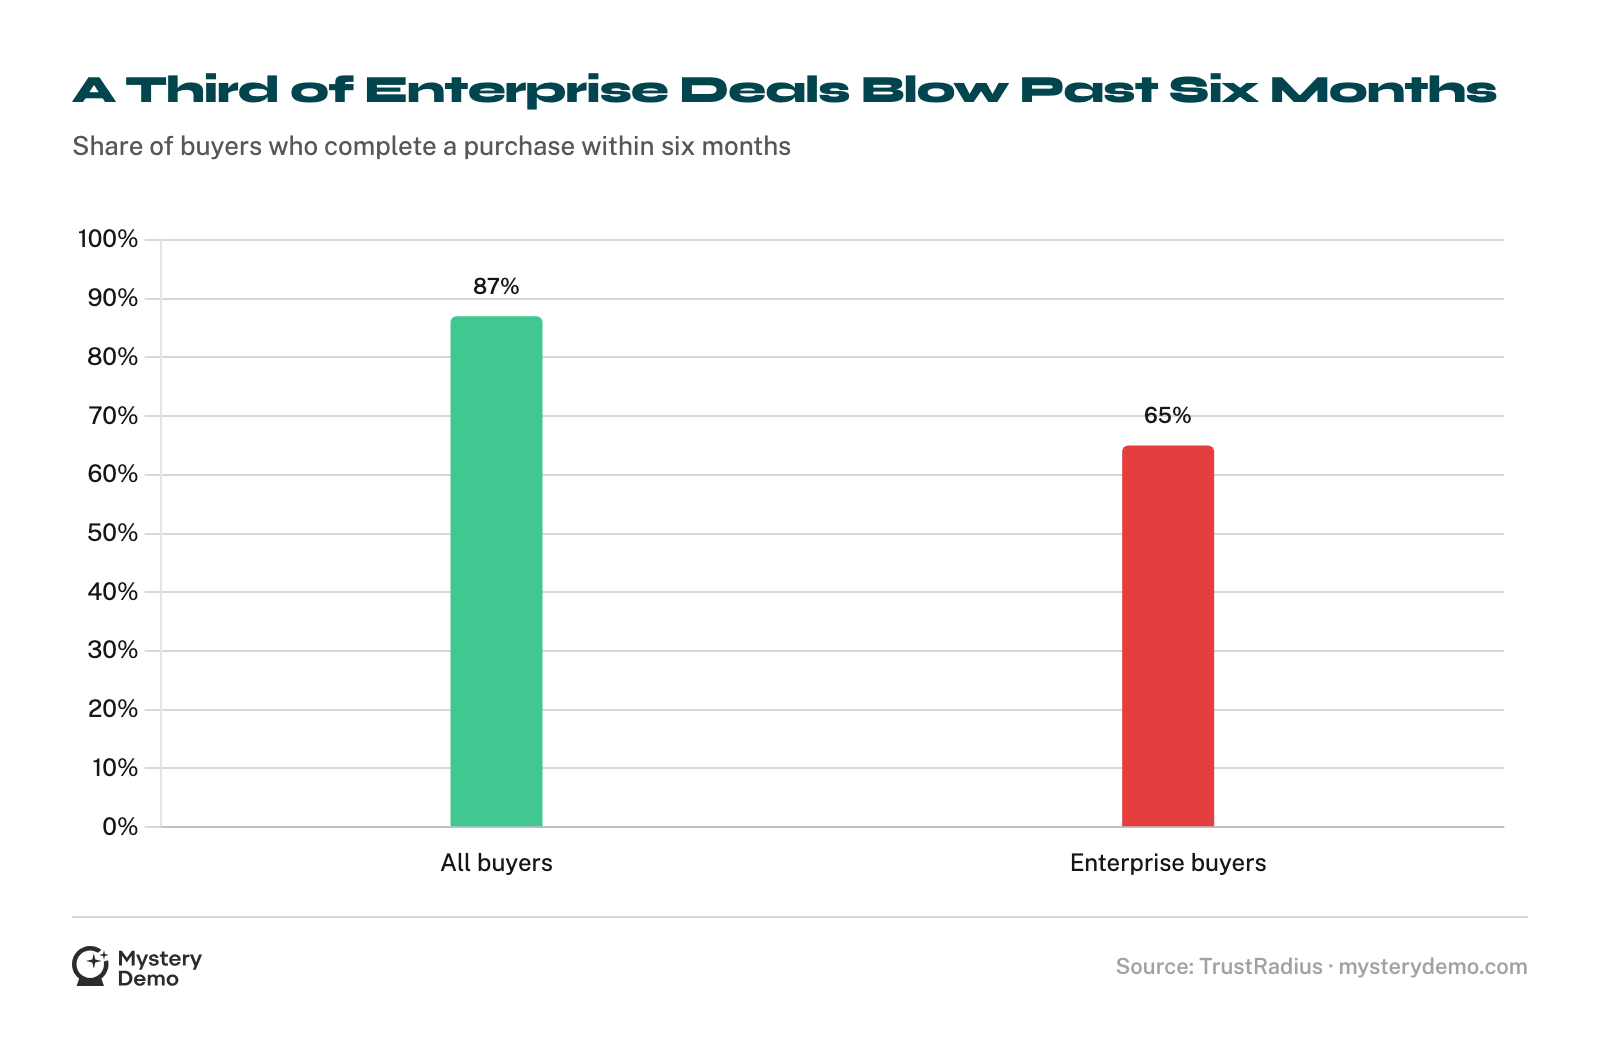
Put those two together and the enterprise cycle comes into focus. A third of large deals blow past six months over the sign-off: a budget that has to be defended, a finance team that has to be convinced, an approval chain that has grown longer as money has gotten tighter.
Most of that wait is a queue the rep does not control, which is why the reps rarely hold the deal up themselves.
That is why the sharpest competitive read at the top of the market is whether the rep arms the champion to win the internal budget battle after the demo, in the meetings no vendor attends.
All of this is observable from the outside. Running a competitor’s full process as a buyer reveals the cycle: how fast they move a warm deal, where they stall, how they handle the budget conversation, and how long they will chase a deal that has gone quiet.
What no benchmark gives you is the stall points on your competitor: their speed by channel, where their clock stops, and the exact stage where it beats or loses to yours.
If your cycle feels slow, the only comparison that settles it is the rival closing the deals you are still working. Let’s time theirs end to end: every stage, every stall, and the point where their clock beats yours.
Frequently Asked Questions
What is the average B2B SaaS sales cycle length?
There is no single number, because it scales with deal size. Median cycles run about 120 days overall, 150 for mid-market, and 408 days at the largest companies4.
How does sales cycle length vary by deal size?
Steeply. A common benchmark puts deals under $2,000 at about 14 days, under $25,000 at 90 days, over $100,000 at three to nine months, and over $500,000 at six to eighteen months3.
What is the optimal sales cycle length by deal size?
Measured against 3.2 million opportunities, the highest-win-rate window is 31 to 60 days for small deals, 61 to 90 for medium, and 150 to 180 for large2.
Does a bigger deal always mean a longer sales cycle?
No. In one regression, cycle length and deal size shared only 26.8% of the variance5, so stakeholder count and complexity matter more than price.
How long does an enterprise SaaS deal take to close?
Often more than six months. Only 65% of enterprise buyers complete a purchase within six months, versus 87% of buyers overall7, and median cycles at the largest companies reach 408 days4.
Are sales cycles getting longer?
Yes. Across 4.2 million opportunities, cycles grew 16% longer in the first half of 2023 and 38% longer than in 20211.
By how much have sales cycles lengthened?
By weeks. 66% of SaaS leaders reported longer cycles than in early 2022, with 42% saying two to three weeks longer and 35% saying four to five6.
Which deals are still closing fast?
Only the smallest. Deals under $10,000 were the only size band to speed up year over year; every larger band slowed4.
Why are B2B sales cycles getting longer?
Mostly budget caution. 61% of revenue professionals name budget and economic uncertainty as their top concern4, which adds approval steps and scrutiny to every deal.
Do inbound deals close faster than outbound?
Much faster. Organic inbound runs at 3.6x the velocity of the average channel, while outbound runs at just 0.3x despite generating the most pipeline1.
What is the fastest sales channel?
Partner referral, at 3.8x velocity, turning 10% of pipeline into 31% of revenue, yet fewer than one in ten companies runs one1.
Is inbound always better than outbound for sales velocity?
No, it flips with company size. Inbound wins above 500 employees, doubling velocity, while outbound wins below 500, where its deals run 3x larger1.
Does account targeting affect cycle speed?
Substantially. High-intent accounts close 3.4x faster, and the best-performing buyer personas saw velocity improve 488%1.
What does it mean when a deal is open too long?
Usually that it is dying. A deal open longer than twice the average cycle has only a 3% chance of closing2.
What slows down enterprise deals the most?
Approval. 31% of enterprise buyers call getting approval difficult7, and the budget sign-off, not the product evaluation, is where large deals tend to stall.
Does the sales channel predict cycle length?
As much as anything does. A warm referral or high-intent inbound deal arrives partway through the trust-building, so it moves at multiples of a cold outbound deal’s velocity1.
What does a competitor’s sales cycle reveal about them?
How they are sourced and how they sell. The speed of a rival’s warm versus cold deals, and where they stall, show how mature their motion is, which is what we capture for you, stage by stage.
References
- Ebsta and Pavilion: 2024 B2B Sales Benchmarks (2024)
- Ebsta and Pavilion: 2023 B2B Sales Benchmark Report (2023)
- SaaStr: What Is a Good Benchmark for B2B Sales Cycles? (2023)
- Outreach: Sales 2024, A Revenue Data Analysis (2024)
- HockeyStack Labs: ACV, Sales Cycles, and Sales Reps (2024)
- Capchase: Survey on SaaS Sales Trends, Decreasing ACV and Lengthening Sales Cycles (2023)
- TrustRadius: 2024 B2B Buying Disconnect Report (2024)
.png)


