
The price on a SaaS pricing page is the most confident-looking number a vendor publishes, and it is usually the least durable.
The model underneath it is moving, from seats to usage to hybrid to outcomes, and half of software companies changed pricing at least twice in the past year8.
Our seat for all of this is the pricing conversation itself: we sit through competitors’ demos as a real buyer and watch the model a vendor advertises on the site turn into the one the rep quotes once the call gets real.
We collected the most relevant, independently verified SaaS pricing statistics we could source: which models are winning, how billing splits between annual and monthly, how often prices move, and how far the real number sits below the published one.
Every figure below is footnoted to its original source.
If you only keep a handful of these B2B SaaS pricing statistics, keep these:
How B2B SaaS Prices in 2026
Start with the structural snapshot, because the popular mental model is a decade out of date. The flat per-seat subscription is no longer the whole story, it is just the largest single slice of a much more fragmented picture.
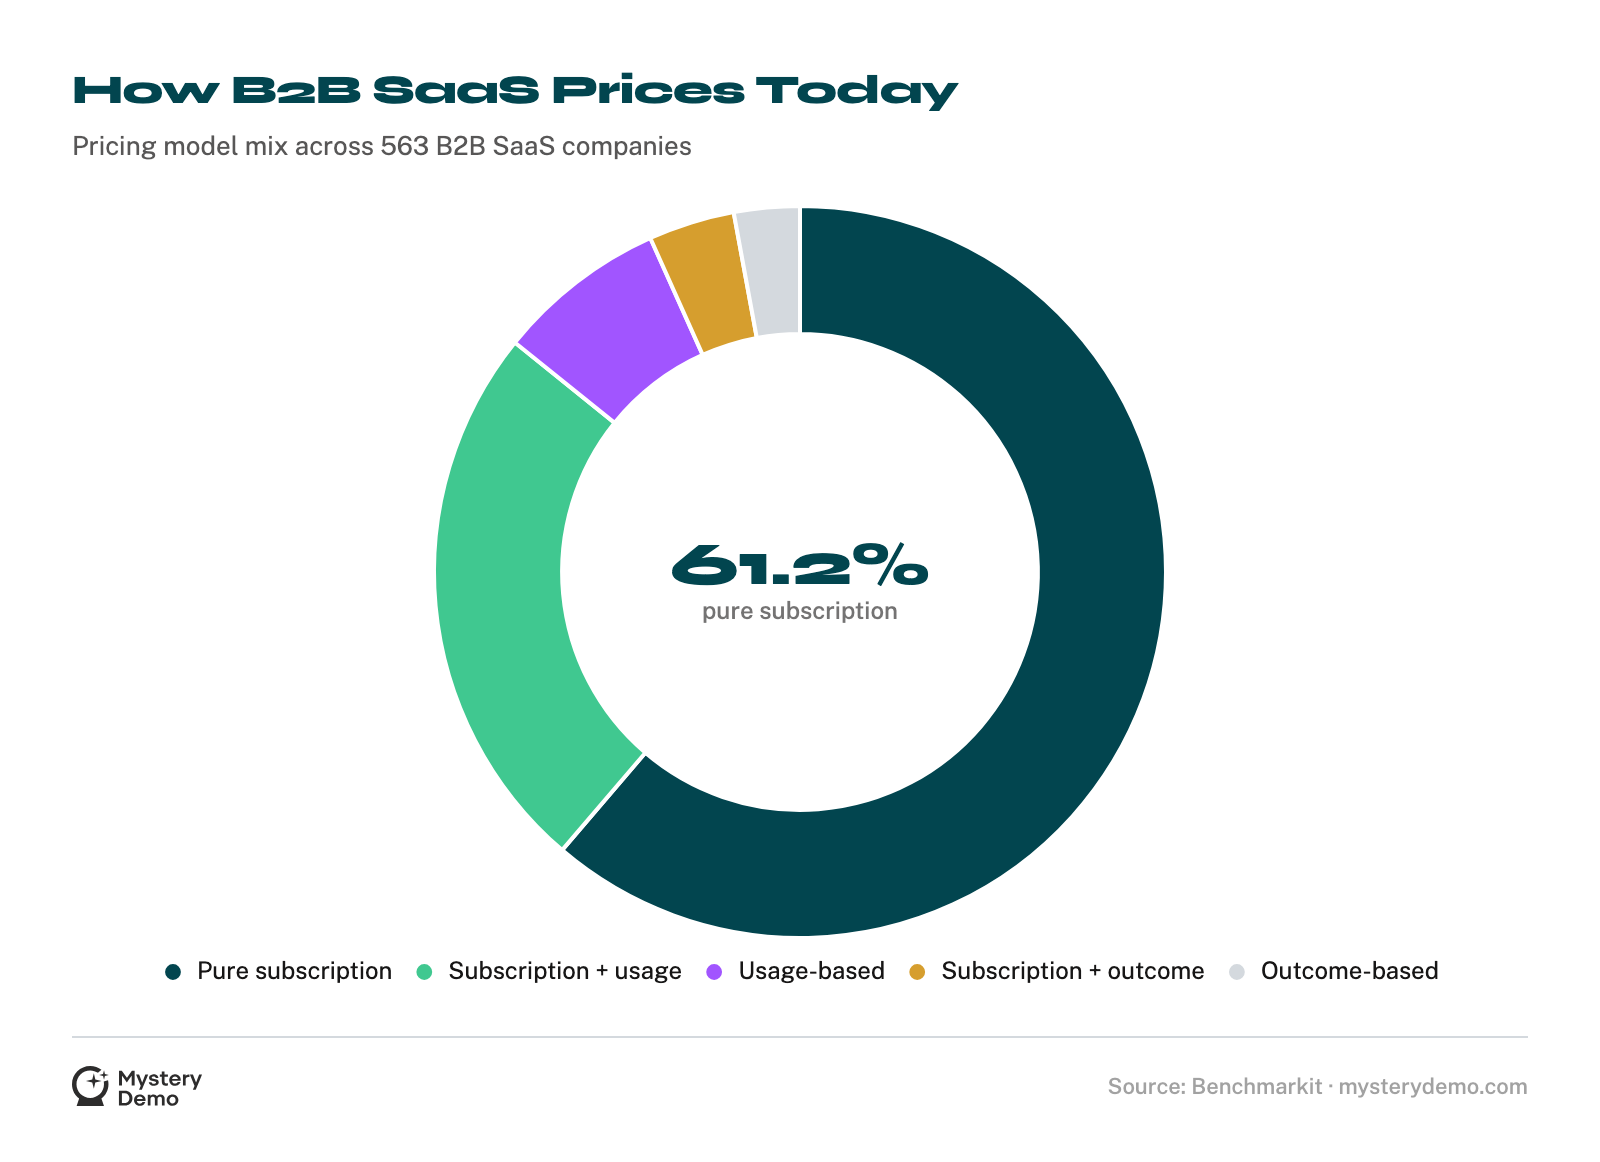
Subscription is still the largest single model, because three out of five companies price that way. The rest of the market has fragmented into hybrid, usage, and outcome models that no longer read as experiments.
The direction and the speed matter more than today’s mix, and that is what the rest of these numbers describe.
Usage-Based Pricing Stopped Being a Fringe Idea
For years usage-based pricing was the thing analysts predicted and founders postponed. By 2025 the founders had stopped postponing.
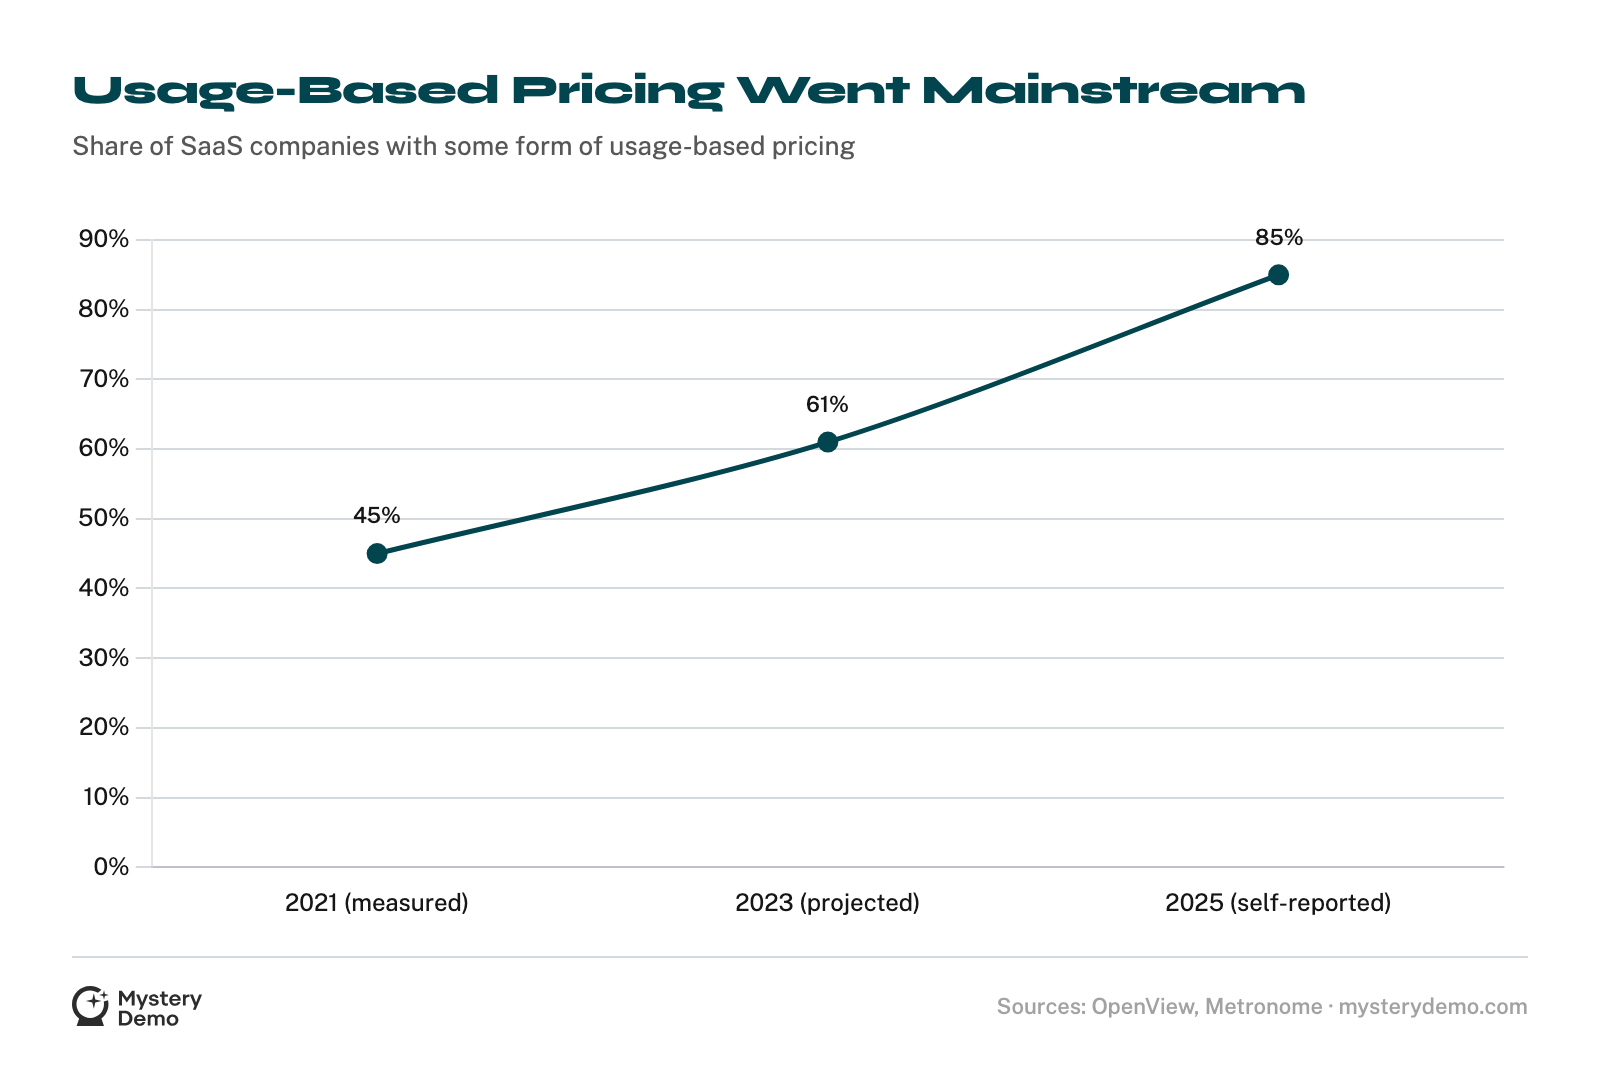
The trend line is hard to argue with: a measured 45% in 2021, a projected 61% by the end of 2023, and a 2025 survey that puts adoption at 85%.
Treat the highest figure with a little care. It comes from a billing vendor surveying its own corner of the market, and “having adopted some level of usage-based pricing” can mean anything from a metered add-on to a full consumption model.
The honest read is not the exact percentage in any single year. It is that a model most founders called risky in 2020 is now the default assumption, and the holdouts are the ones who have to explain themselves.
In Practice, Usage-Based Means Hybrid
Almost nobody who adopts usage pricing throws out the subscription. They bolt usage onto it.
Hybrid keeps winning on the scoreboard: the fastest median growth and the best retention of any model here.
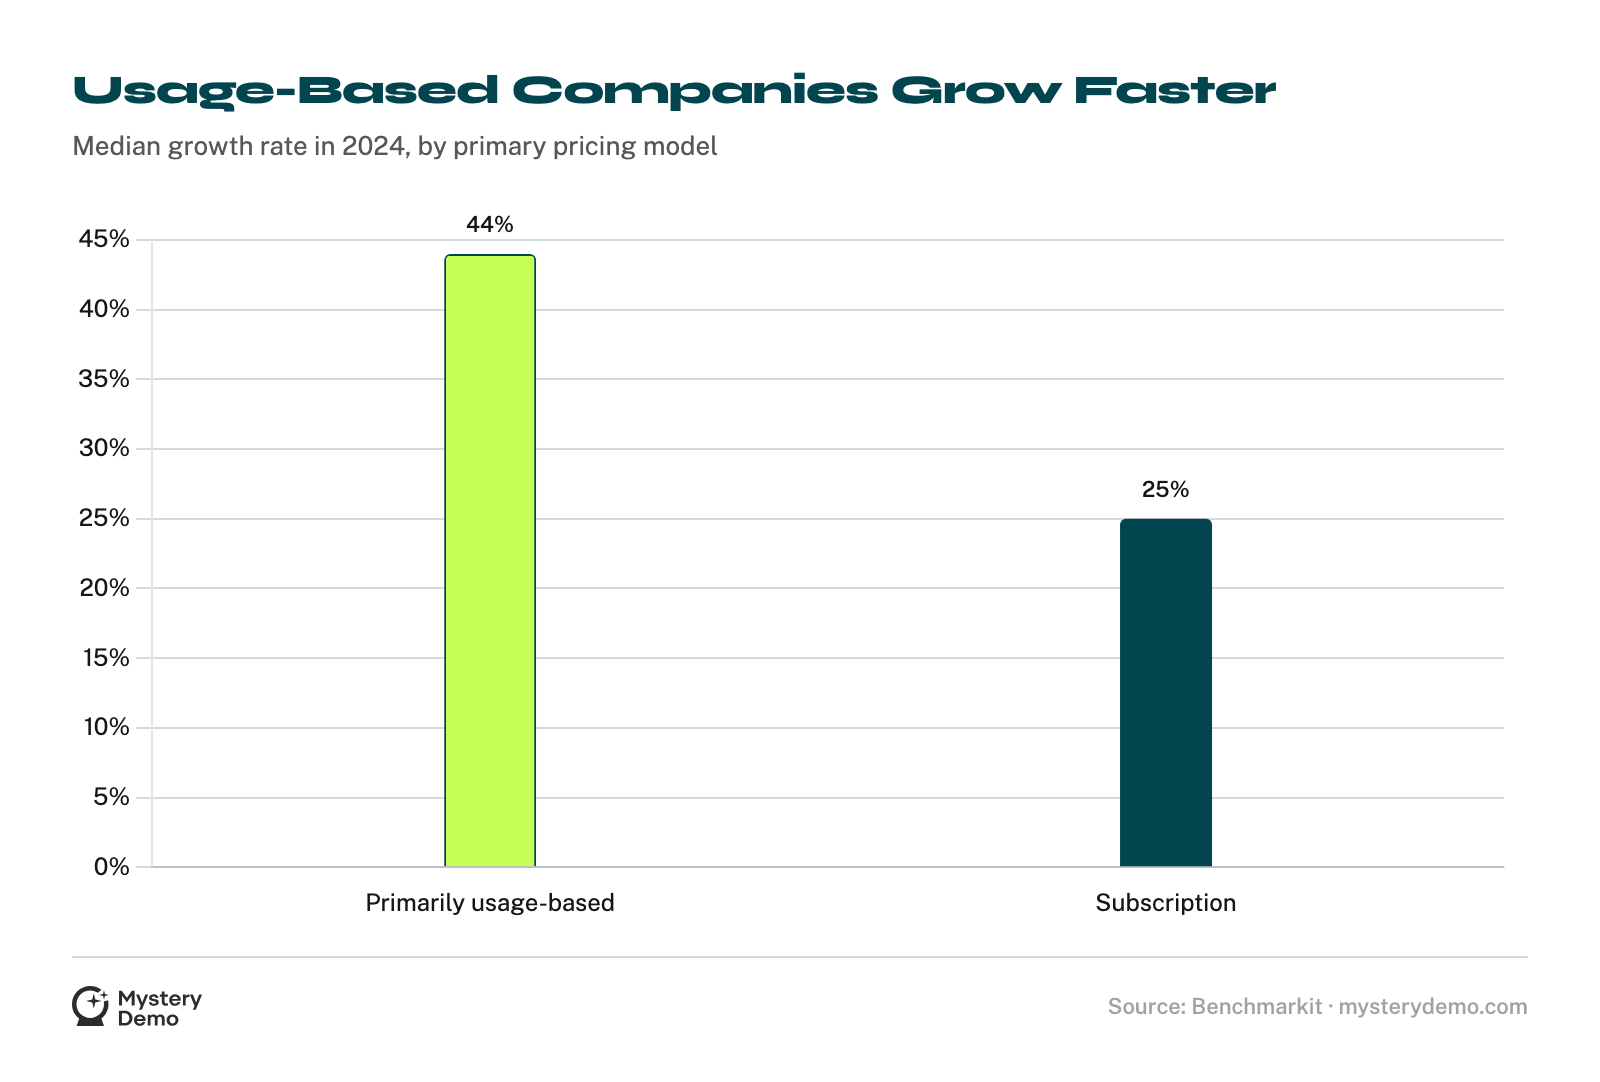

A benchmarking firm and a billing platform, working from separate data, land on the same answer: a predictable base with a variable layer grows fastest and retains best.
That is worth holding next to the adoption numbers. The market moved to usage because hybrid correlates with the two metrics every board watches, growth and retention.
How SaaS Gets Billed: Annual, Monthly, and Multi-Year
Pricing model is what you pay for. Billing is when and how often you pay, and the data here overturns a common assumption that bigger companies always skew toward annual prepay.
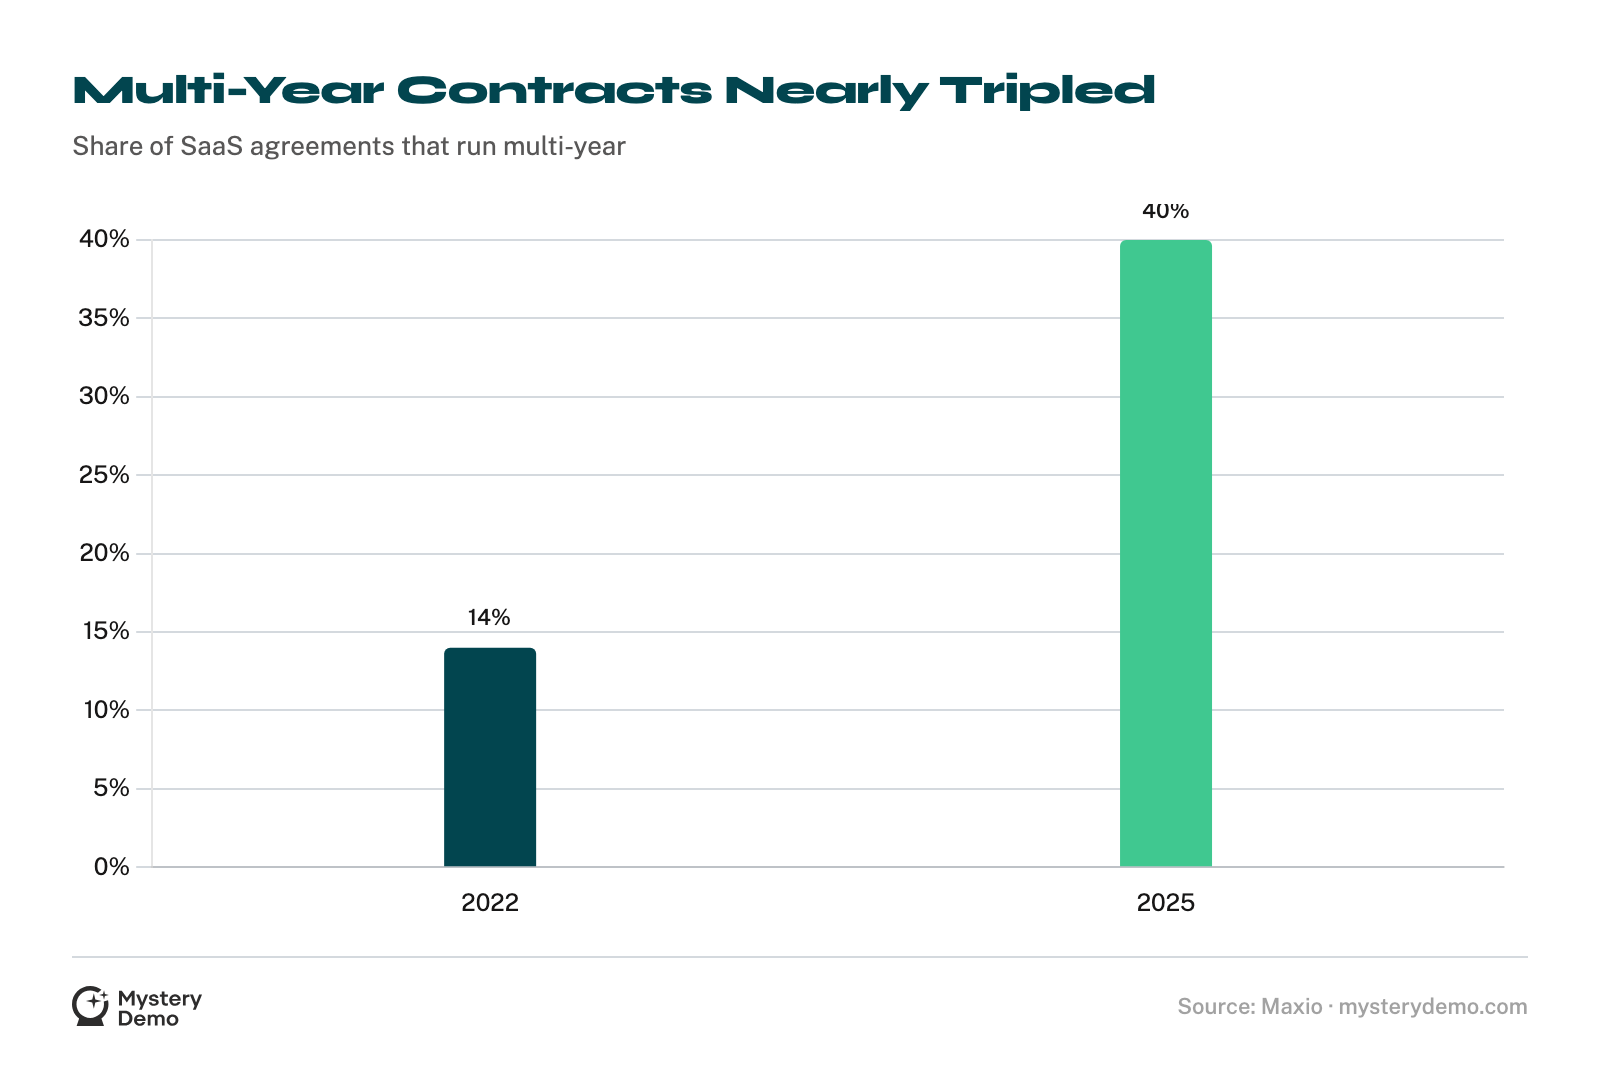
The two trends look contradictory and are not. Contracts are getting longer at the top, where multi-year deals have nearly tripled since 2022.
Billing, meanwhile, is getting more frequent at the usage end, where consumption is metered and invoiced in shorter cycles.
A modern SaaS company often does both at once: a three-year commitment, billed in pieces, with a usage meter running underneath. The single annual invoice is no longer the shape of the category.
Pricing Has Become a Moving Target
The old world set a list price and revisited it grudgingly. The current one reprices on a schedule that would have looked reckless five years ago.
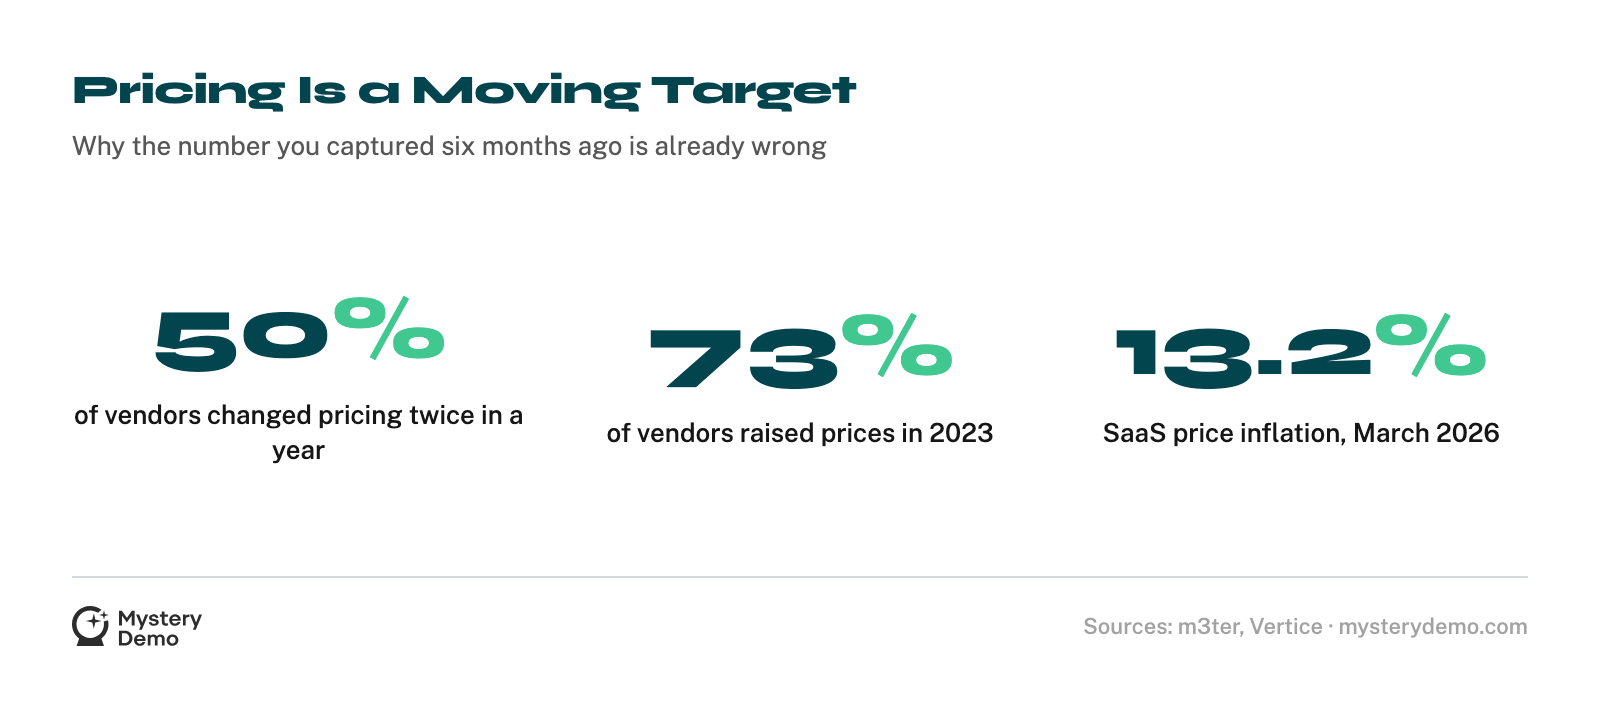
Put the repricing cadence next to the inflation figures and the strategic problem becomes obvious. A list price is now a snapshot with a short shelf life, and the rate of increase runs well ahead of general inflation.
The real cost of a software stack climbs double digits a year even when nothing about the product changes. For anyone tracking a competitor’s pricing, a number you captured six months ago is simply wrong.
List Price Is the Opening Bid
All of which leads to the gap that defines pricing intelligence: the distance between the number a vendor publishes and the number a buyer pays.
The average discount from list price across all software categories is 34%, which is why negotiation has become a core part of procurement11.
A 34% average gap is structural: vendors print a list price partly so they have something to discount from, and the published figure functions as an anchor rather than a quote.
That is the single most useful thing to understand about SaaS pricing pages: they are designed to be the high end of a range, not the price.
.png)

You can read every benchmark in this article and still not know how your three closest competitors price, because the numbers that matter are quoted on live calls, not printed on pages.
We take those calls for you and hand back the model they quote, the cadence they push, and the discount they reach for before you even ask. For the structured version, our SaaS competitor pricing research turns those calls into a side-by-side you can price against.
The model on a pricing page is an opening position. The model quoted on a call is the real one, and you have never heard a rival say it out loud. Let us take the call for you, and you will have both.
Frequently Asked Questions
What is the most common B2B SaaS pricing model?
Pure subscription, used by 61.2% of B2B SaaS companies, followed by subscription plus usage at 24.5% and pure usage-based at 7.5%1.
Is pure subscription still the majority of SaaS pricing?
Only just. Subscription is the largest single model at 61.2%, but hybrid, usage, and outcome models together account for nearly 39% of vendors1.
How many SaaS companies use usage-based pricing?
OpenView projected 61% of the SaaS index would adopt some form of usage-based pricing by the end of 2023, up from a measured 45% in 2021, with a 2025 vendor survey putting self-reported adoption as high as 85%234.
Is usage-based pricing usually pure or hybrid?
Hybrid. Among companies that price on usage, 72% use a subscription base plus usage versus 28% on consumption alone, and hybrid is roughly three times as common as a largely usage-based model52.
Do usage-based SaaS companies grow faster?
Yes. Primarily usage-based companies grew at a median of 44% in 2024 against 25% for subscription companies, and hybrid models post the highest median growth at 21%16.
Which pricing model has the best net revenue retention?
Hybrid. A subscription-plus-usage model has a median net revenue retention of 110%, higher than usage or subscription on their own1.
How is AI changing SaaS pricing models?
AI products still lean on subscription (58% include a platform component) but are pulling toward consumption (35%) and outcome-based (18%) pricing, and 37% of companies plan to change their AI pricing within a year13.
What share of SaaS revenue comes from annual versus monthly billing?
It depends on stage. Annual billing’s share of ARR peaks at 47% around $3M to $8M ARR, then falls to 28% by $15M to $30M ARR, where 72% of revenue comes from monthly7.
Do higher-priced SaaS products bill more on annual contracts?
Yes. Products at $1,000 ARPA or above get 55% of revenue from annual contracts and 34% from monthly, the inverse of mid-priced products7.
Do most SaaS companies offer both monthly and annual billing?
Yes. Offering a mix is standard: 78% of early-stage SaaS offer both, rising to 95% at $8M to $15M ARR7.
How common are multi-year SaaS contracts?
Increasingly common. Multi-year contracts now make up 40% of SaaS agreements, up from 14% in 20226.
Are SaaS companies billing more or less frequently?
More. 43% of SaaS companies now bill more frequently than monthly, driven by usage and consumption models invoiced in shorter cycles6.
How often do SaaS companies change their pricing?
Often. Half of software companies changed pricing at least twice in the past year, a pace that would have been unusual a decade ago8.
How often do SaaS companies raise prices?
Most years. 73% of software vendors raised prices in 2023, with software inflation at 8.7%, more than double the US consumer rate9.
What is the current SaaS price inflation rate?
13.2% as of March 2026, nearly two points higher than a year earlier, though down from a 14.7% peak in late 202510.
How big is the gap between SaaS list price and what buyers pay?
Large. The average discount from list price across software categories is 34%, so realized prices sit well below published list11.
Why do SaaS companies publish a list price at all?
Mostly to anchor. With an average 34% gap to realized price, the published figure works as the high end of a negotiable range rather than a firm quote11.
Is a free trial or freemium more common in SaaS?
Free trial, by more than two to one. 57% of products use a free trial as their main entry point versus 26% for freemium12.
What is the standard SaaS free-trial length?
Fourteen days. 62% of products run a 14-day trial, followed by 7-day and 30-day trials at 14% each12.
Do SaaS free trials require a credit card?
Usually not. Among free-trial products, 80% ask for no credit card upfront and only 20% require one12.
What counts as the fastest-growing SaaS pricing model?
Hybrid and usage. Hybrid posts the highest median growth at 21%, and usage-based companies grew at a median of 44% in 202461.
How recent is the shift to usage-based pricing?
Very. 78% of companies with usage-based pricing adopted it within the last five years, and nearly half within the last two4.
Does company size determine the pricing model?
Less than you would expect. Usage-based pricing spans the curve, with 77% of the largest software companies and 64% of next billion-dollar startups using it4.
Why does competitor pricing research need more than the pricing page?
Because the page lags the pitch. With models shifting, prices changing twice a year, and a 34% average discount off list, the public page reflects a vendor’s old position, not the model and number they quote on a live call811.
References
- Benchmarkit with Pavilion: 2025 B2B SaaS Performance Metrics Benchmarks (2025)
- OpenView: The State of Usage-Based Pricing, 2nd Edition (2023)
- OpenView: Usage-Based Pricing Adoption Up 32% (2021)
- Metronome with Greyhound Capital: State of Usage-Based Pricing 2025 (2025)
- m3ter with PwC UK: Is Usage-Based Pricing Right for My SaaS Business (2026)
- Maxio powered by Benchmarkit: 2025 SaaS Pricing Report (2025)
- ChartMogul: SaaS Billing Report (2025)
- m3ter with PwC UK: Revenue Integrity and Usage-Based Pricing Survey (2026)
- Vertice: 2023 SaaS Inflation Index (2023)
- Vertice: SaaS Inflation Rate (2026)
- Vertice: Average Discount From List Price (2026)
- ChartMogul with ProductLed: The Conversion Report 2026 (2026)
- ICONIQ Growth: 2026 State of AI, Bi-Annual Snapshot (2026)
.png)


