
A no-show is the cheapest way to lose a deal, because you never had the deal in the first place. The demo got booked, the slot went on two calendars, the pipeline number ticked up, and then nobody joined.
A booked demo is a promise made by a stranger who owes you nothing, and a surprising share of them quietly break it.
We book competitors’ demos as a real buyer, on your behalf, which makes us the no-show in somebody’s pipeline report more often than you would think.
The vendors who lose us are almost always the slow ones, the ones who put a week between the click and the call.
We collected the most useful, independently verified SaaS demo no show statistics we could source, from booking platforms that measure held meetings, sales-call datasets, and the deep research on missed appointments. Each number is footnoted to the study behind it.
The short version: almost every lever that fixes a no-show belongs to the seller, and most of them are scheduling choices made before the buyer ever decides anything.
If you only keep a handful of these, keep these:
One in Seven Booked Demos Never Happens
Start with the number everyone guesses at and few measure. In a single week of 6,428 booked B2B sales meetings, 419 ended in no-shows, an overall rate of 6.5%1.
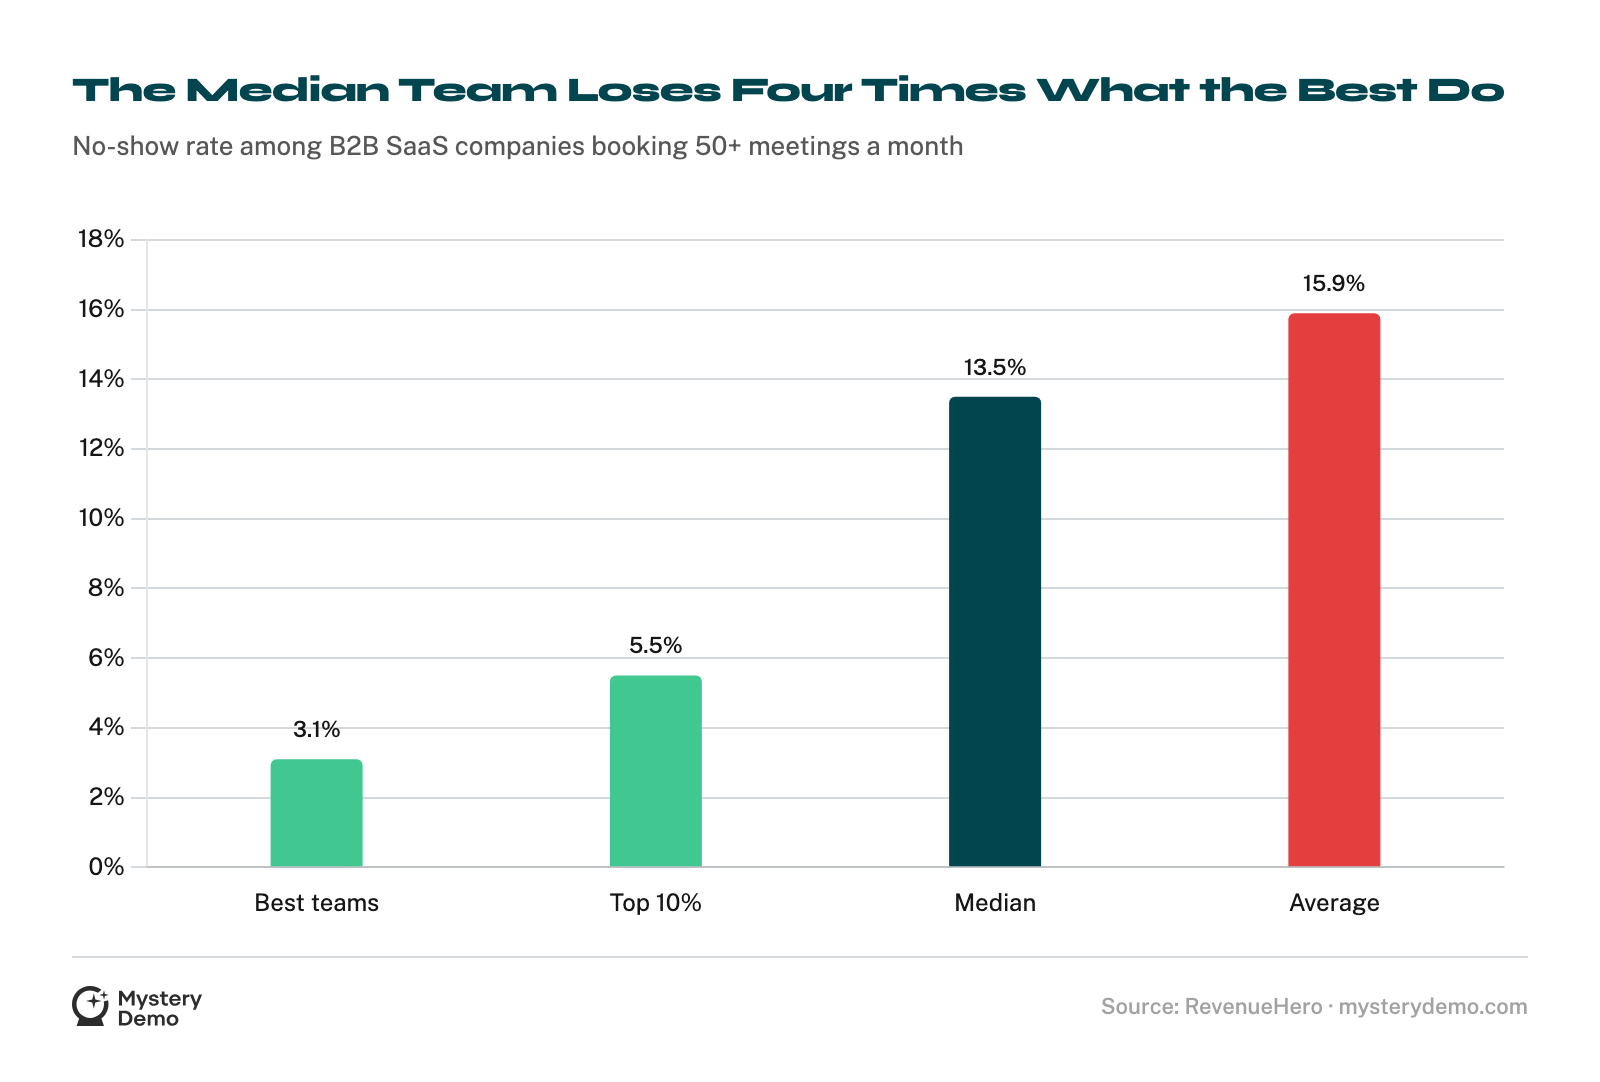
That is the clean, fully-counted version. The lived version is worse, because the average hides a huge spread.
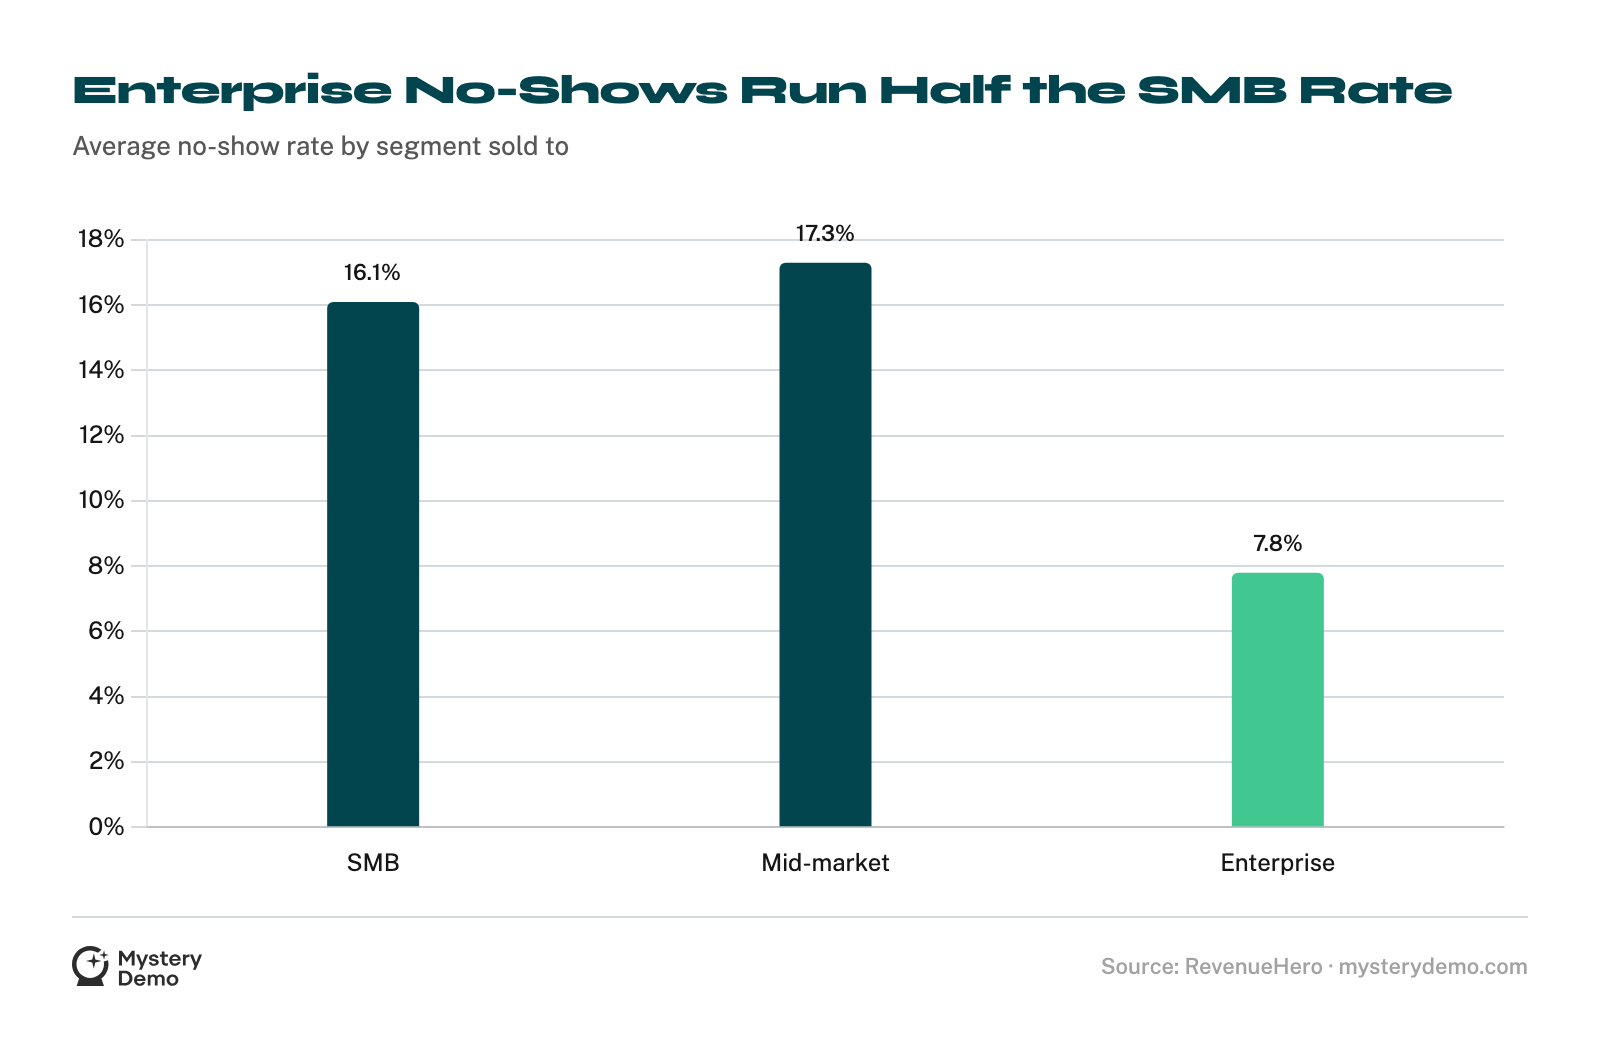
The segment split invites a flattering explanation: enterprise buyers are simply more serious. The source says otherwise. Enterprise teams post the cleanest rates because they have already bought the reminder, routing, and qualification machinery that SMB teams skip.
A 13.5% median measures how much scaffolding a team put under the booking, and how much it still leaves the buyer to remember on their own.
The No-Show Clock Starts at Booking
The single biggest predictor of whether a demo happens is how long the buyer has to wait, not who they are. Every day between the booking and the call is a day for the intent to cool and the calendar to fill.
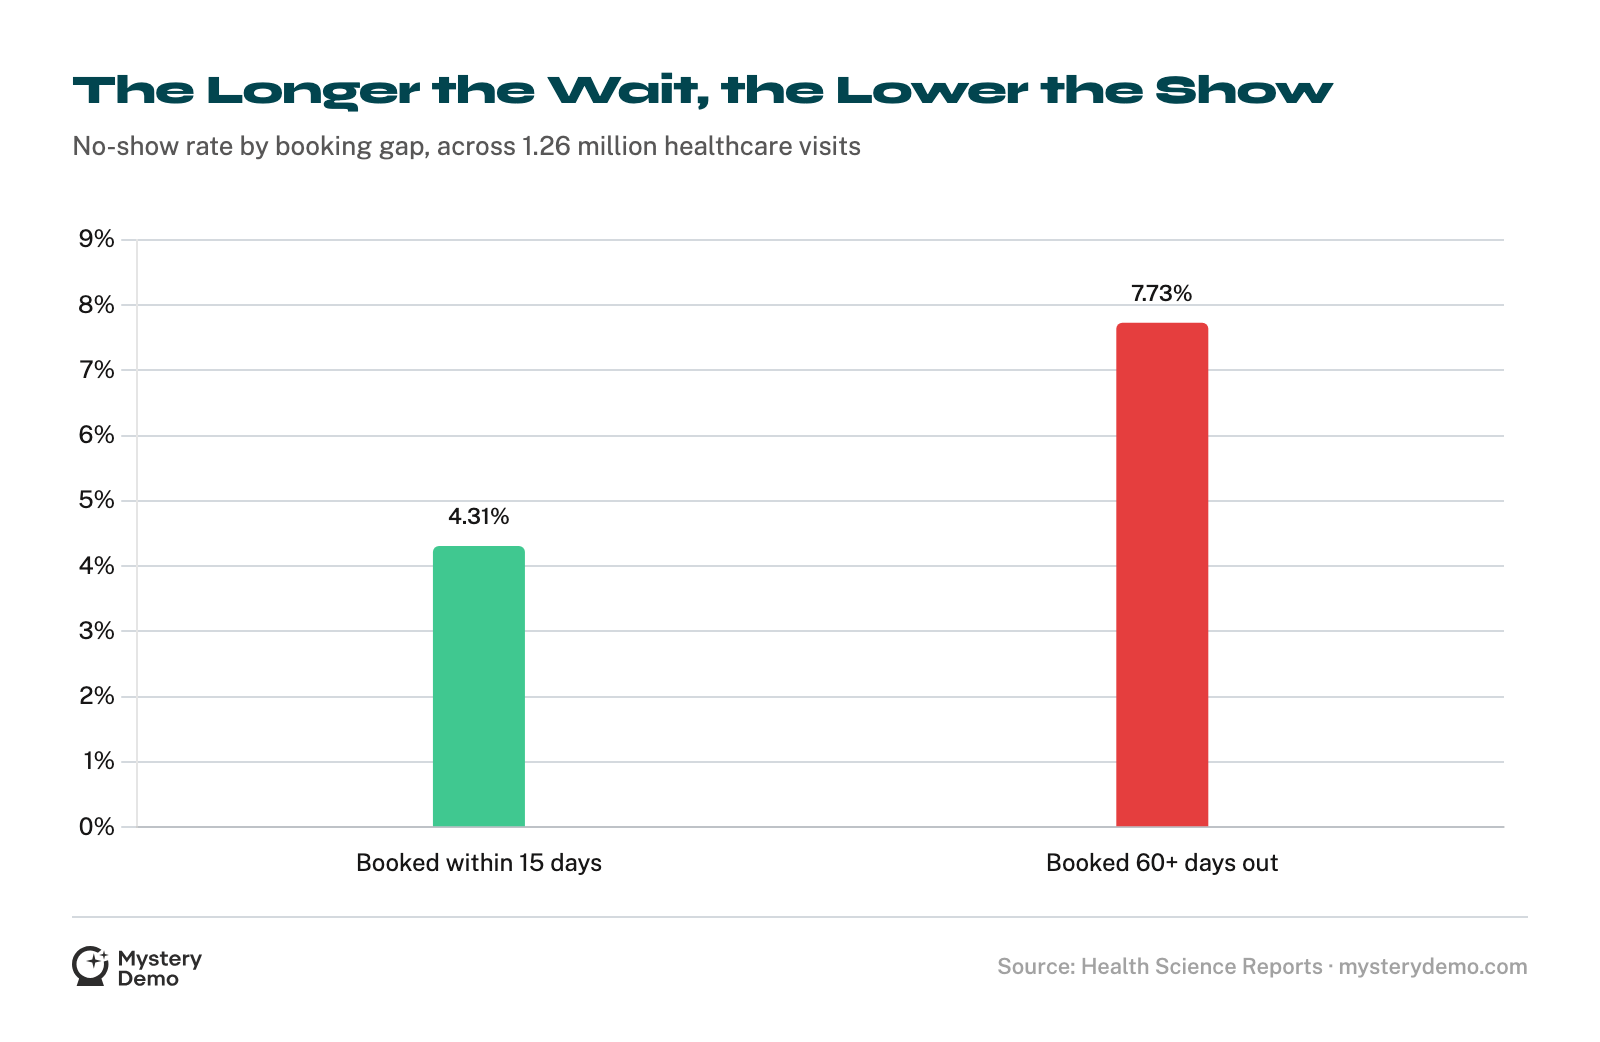
The healthcare number is worth sitting with, because it is the same shape in a completely different world. The most-studied no-show problem on earth is medicine, and it reports what the sales data reports: the longer the wait, the lower the show.
A demo booked for next Thursday competes with everything that lands in the buyer’s inbox between now and Thursday. The buyer almost never wins that fight on your behalf.

Speed to Lead Is the Whole Game
The wait starts the second the buyer raises a hand, well before the booking, and the decay there is brutal, old, and remarkably consistent. The numbers below predate most modern sales tooling, and nothing since has repealed them.
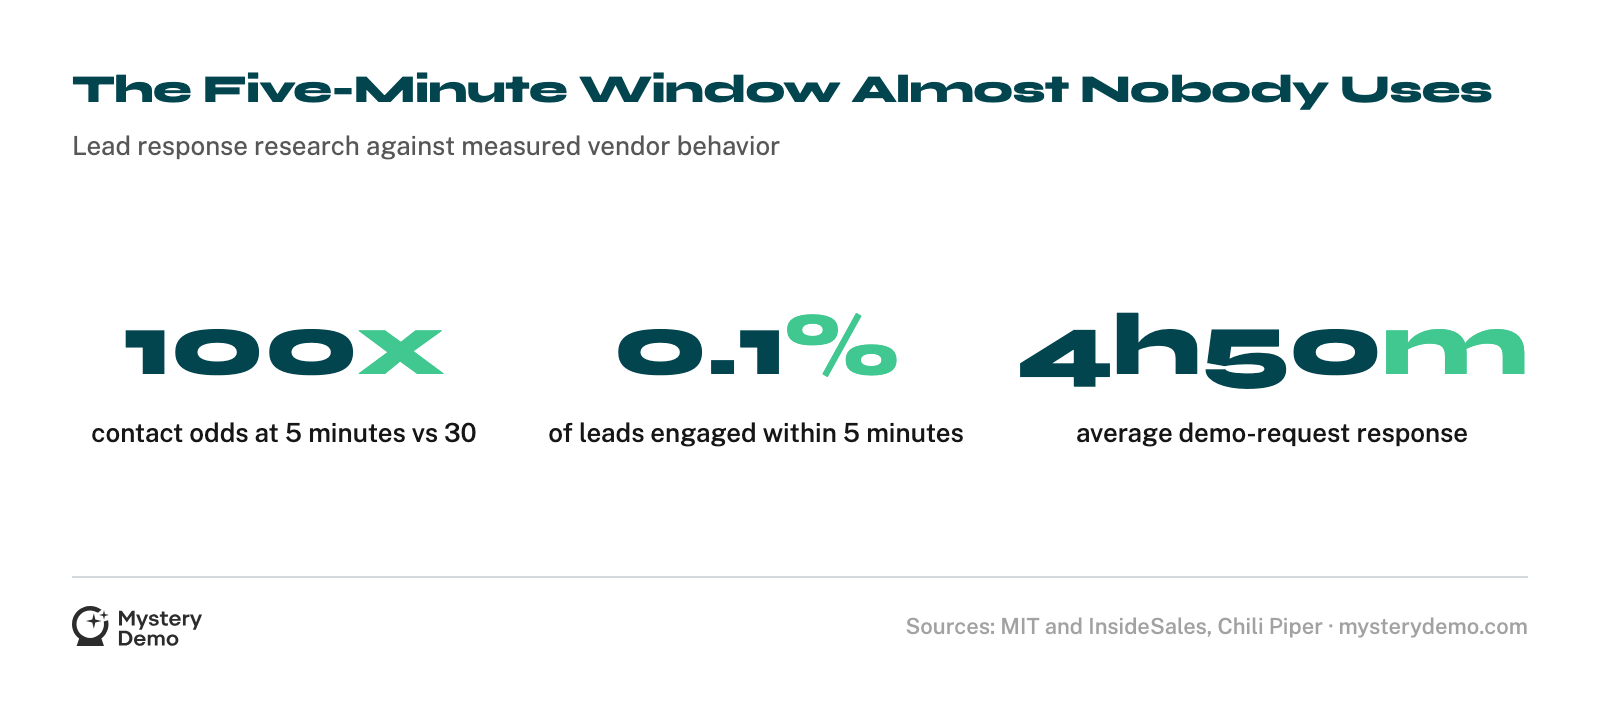
The gap between the first two numbers and the last two is the entire opportunity. The research says respond in five minutes; the field says the average vendor takes nearly five hours, and most take over a week to try at all.
That gap is a queue problem wearing a buyer problem’s clothes, and it is the first thing we clock on a competitor: how long the silence lasts before anyone notices we raised our hand.
Timing that silence is part of what a competitor sales-tactics review turns up.
.png)

A Shorter Slot and a Later Hour Beat Better Intent
Once the meeting is booked, three almost embarrassing details decide the outcome: the length of the slot, the hour on the clock, and the day of the week. None of them require a better product.
None of this is strategy. A shorter slot is a smaller ask, so more people keep it. An afternoon call sits past the morning chaos that buries early meetings.
Nothing here is magic about 4 p.m. The friction of the ask decides whether the meeting happens, far more than the worth of the meeting does. Make it cheap to keep, and more buyers keep it.
Reminders Are Nearly Free Money
The last lever is the one almost everyone underuses, probably because it feels too cheap to count. Reminding people about the meeting they booked works, and it works at a scale that would be embarrassing to ignore.
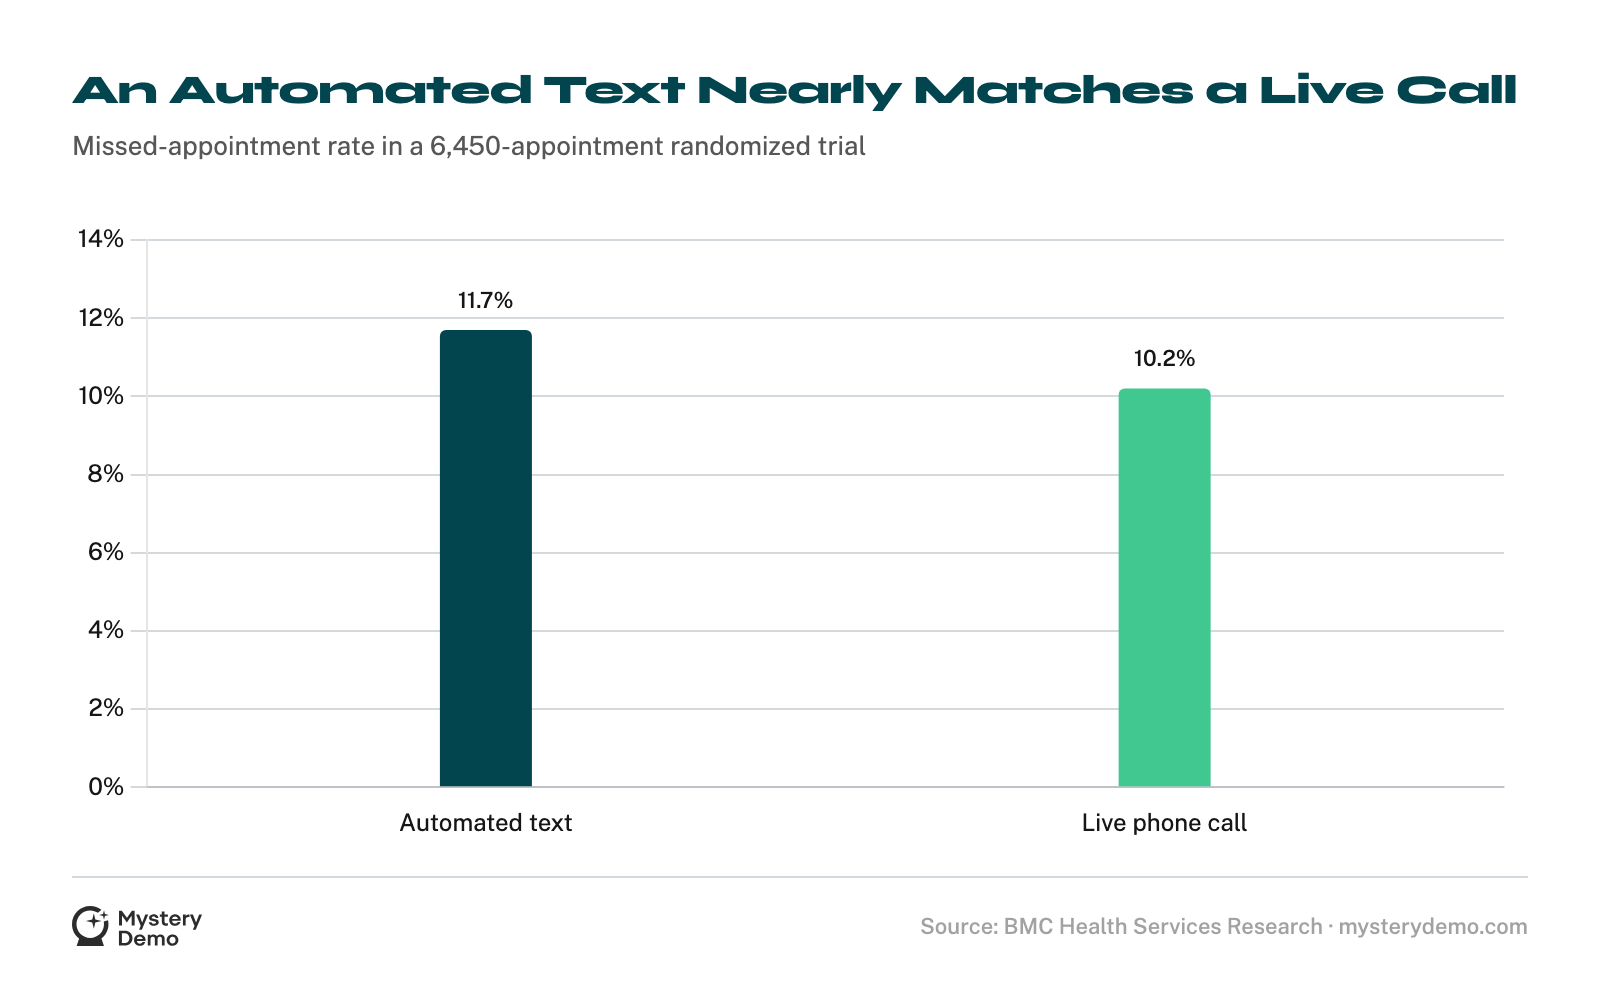
The randomized-trial number is the one to keep, because it kills the usual excuse: that a human call feels more serious than an automated text, so it must work better.
The two arms came out statistically similar, and the automated one costs a fraction as much and never forgets.
Stack the levers and the picture is consistent. A no-show rate is the sum of every small choice the seller already made: how fast they replied, how soon the call was, how long the slot ran, and whether anyone bothered to remind the buyer.
All of this is visible from the outside. A competitor’s booking machinery is the first thing we meet.
What no benchmark gives you is the timeline on your competitor: the response speed, the scheduling lag, the reminder cadence, and every place a rival loses the buyer before the call.
A competitor’s no-show rate never gets published, but every input to it can be measured from the outside. Have us book the call and start the clock: how fast they reply, how long until the slot, and how hard they work to keep it.
Frequently Asked Questions
What is a normal demo no-show rate in B2B SaaS?
The median is around 13.5%, with an average closer to 15.9%2; a single week of 6,428 booked meetings showed an overall rate of 6.5%1. Rates vary widely by industry and segment.
What is a good demo no-show rate?
The top 10% of B2B SaaS teams hold no-shows at 5.5% or below, and the best reach 3.1%2. Anything in the mid-teens is roughly average, not good.
How much does a no-show rate vary by industry?
Enormously. In one week it ran from 1.2% for developer-tools buyers to 18.1% for education software, with healthcare at zero that week, a 15-fold spread1.
Do enterprise deals have fewer no-shows than SMB?
Yes, by a wide margin. Enterprise averages a 7.8% no-show rate versus 17.3% for mid-market and 16.1% for SMB, largely because enterprise teams invest in reminders, routing, and qualification2.
What share of booked sales meetings happen?
About 86%. Across 39,679 booked outbound meetings, 85.94% were held, meaning roughly one in seven never took place3.
Does scheduling a demo further out increase no-shows?
Yes. Meetings booked more than four days out showed up only 60% of the time; a confirmation sequence lifted that to a steady 80 to 82%3.
Is there hard evidence that booking lag causes no-shows?
Yes, from the most-studied setting. Across 1.26 million healthcare visits, no-show rates rose from 4.31% within 15 days to 7.73% past 60 days as the booking gap grew11.
How does response time affect getting a meeting at all?
Dramatically. Calling a web lead within five minutes rather than thirty makes the odds of reaching them about 100 times higher and qualifying them about 21 times higher6.
How fast do leads get a response in practice?
Far too slowly. A blind test of B2B vendors found an average demo-request response of four hours and fifty minutes, with only 7% answering in under a minute8.
What percentage of leads are contacted within five minutes?
Almost none. Across 5.7 million inbound leads, only 0.1% were engaged in under five minutes, and 57.1% of first attempts came more than a week later7.
Does meeting length affect show rate?
It does. A prospect is 12% more likely to show up to a 30-minute slot than the same meeting booked as 60 minutes5.
What time of day has the best demo show rate?
Afternoons. Booking a call for 4 p.m. instead of 8 a.m. makes a prospect 30% more likely to show, and weekend slots no-show at roughly four times the weekday rate4.
Do automated reminders reduce no-shows?
Yes. In a scheduling vendor’s survey of its own sales users, they cut no-shows by 28% on average using automated reminders, and 88% reported a decrease9.
How many reminders should you send?
A three-touch cadence works well: a reminder 24 hours, one hour, and one minute before the call helped one team hold its outbound no-show rate under 5%10.
Are automated reminders as good as a human calling?
Nearly. In a 6,450-appointment randomized trial, automated texts produced an 11.7% miss rate versus 10.2% for live phone calls, at far lower cost12.
Does booking on the spot reduce no-shows?
Sharply. When a qualified lead can book instantly instead of waiting on an email exchange, one team reported a first-meeting show rate near 99%8.
Why do prospects no-show even after they booked?
Usually because they were left waiting. Intent decays by the hour after a lead is created6, and show rates fall the further out a meeting is booked3, so a slow response plus a distant slot is a recipe for an empty room.
Is a no-show the buyer’s fault or the seller’s?
Mostly the seller’s. No-show rates track with response speed, booking lag, slot length, and reminders, all of which the seller controls, far more than with buyer seriousness2.
What is the cheapest way to lower a no-show rate?
Reminders and speed. In one vendor’s own user survey, automated reminders alone cut no-shows by about 28%9, and responding faster plus booking sooner closes most of the rest63.
What does a competitor’s no-show rate reveal about them?
It reveals how mature their sales operation is. Slow responses, distant scheduling, and missing reminders show up as no-shows, and they tell you exactly where a rival is leaking pipeline they already paid to generate, which is what we capture for you, hour by hour.
References
- RevenueHero: No-Show Benchmark in B2B (2024)
- RevenueHero: How to Reduce No-Show Rates in B2B Sales Calls (2025)
- Cognism: State of Outbound 2026 (2026)
- Gong Labs: The Best and Worst Times to Schedule Sales Calls (2017)
- Gong Labs: Determining the Ideal Duration of a First Sales Call (2017)
- MIT and InsideSales: The Lead Response Management Study (2007)
- InsideSales: Response Time Matters (2021)
- Chili Piper: Chili Insights, Average B2B Vendor Response Times (2022)
- Calendly: How to Decrease Sales No-Show Rates (2020)
- Chili Piper: 8 Simple Tricks to Improve Your Show Rates (2024)
- Health Science Reports: Factors That Influence No-Shows in a Rural Healthcare System (2023)
- BMC Health Services Research: Text-Messaging Versus Telephone Reminders to Reduce Missed Appointments (2013)
.png)


