
Incumbents almost never lose a customer to a better pitch. They lose them to their own renewal invoice, their own unused seats, and their own quiet dissatisfaction, none of which a rival can see from the outside.
Displacement is an inside job, and by the time the switch is visible in a competitive deal, the incumbent already lost it months earlier.
On your behalf, we go through competitors’ funnels as a real buyer, including the incumbents you want to unseat, so we see the renewal pressure, the support gaps, and the friction that turn a locked-in customer into a switchable one long before the deal shows up on anyone’s radar.
We collected the most useful, independently verified SaaS competitive displacement statistics on how often incumbents really get replaced, what triggers the switch, and where the openings hide. Every stat here traces back to the study that produced it.
If you only keep a handful of these, keep these:
Incumbents Lose Customers Faster Than They Think
The myth of the sticky incumbent dies when you look at the churn numbers. Software turns over constantly, and a meaningful slice of every vendor’s base is heading for the exit.
Gross churn near 12% is the number incumbents underplay, because expansion revenue papers over it: a vendor can post net retention above 100% while roughly an eighth of last year’s revenue quietly walks out the door7.
The bottom-quartile finding sharpens it further. A quarter of vendors at mid-market price points are net-shrinking, losing and being switched out faster than they can expand, inside accounts where everything looked fine on the dashboard.
The Renewal Is Where the Switch Happens
Displacement does not happen in a flashy bake-off. It happens at renewal, and the average company runs through hundreds of them a year.
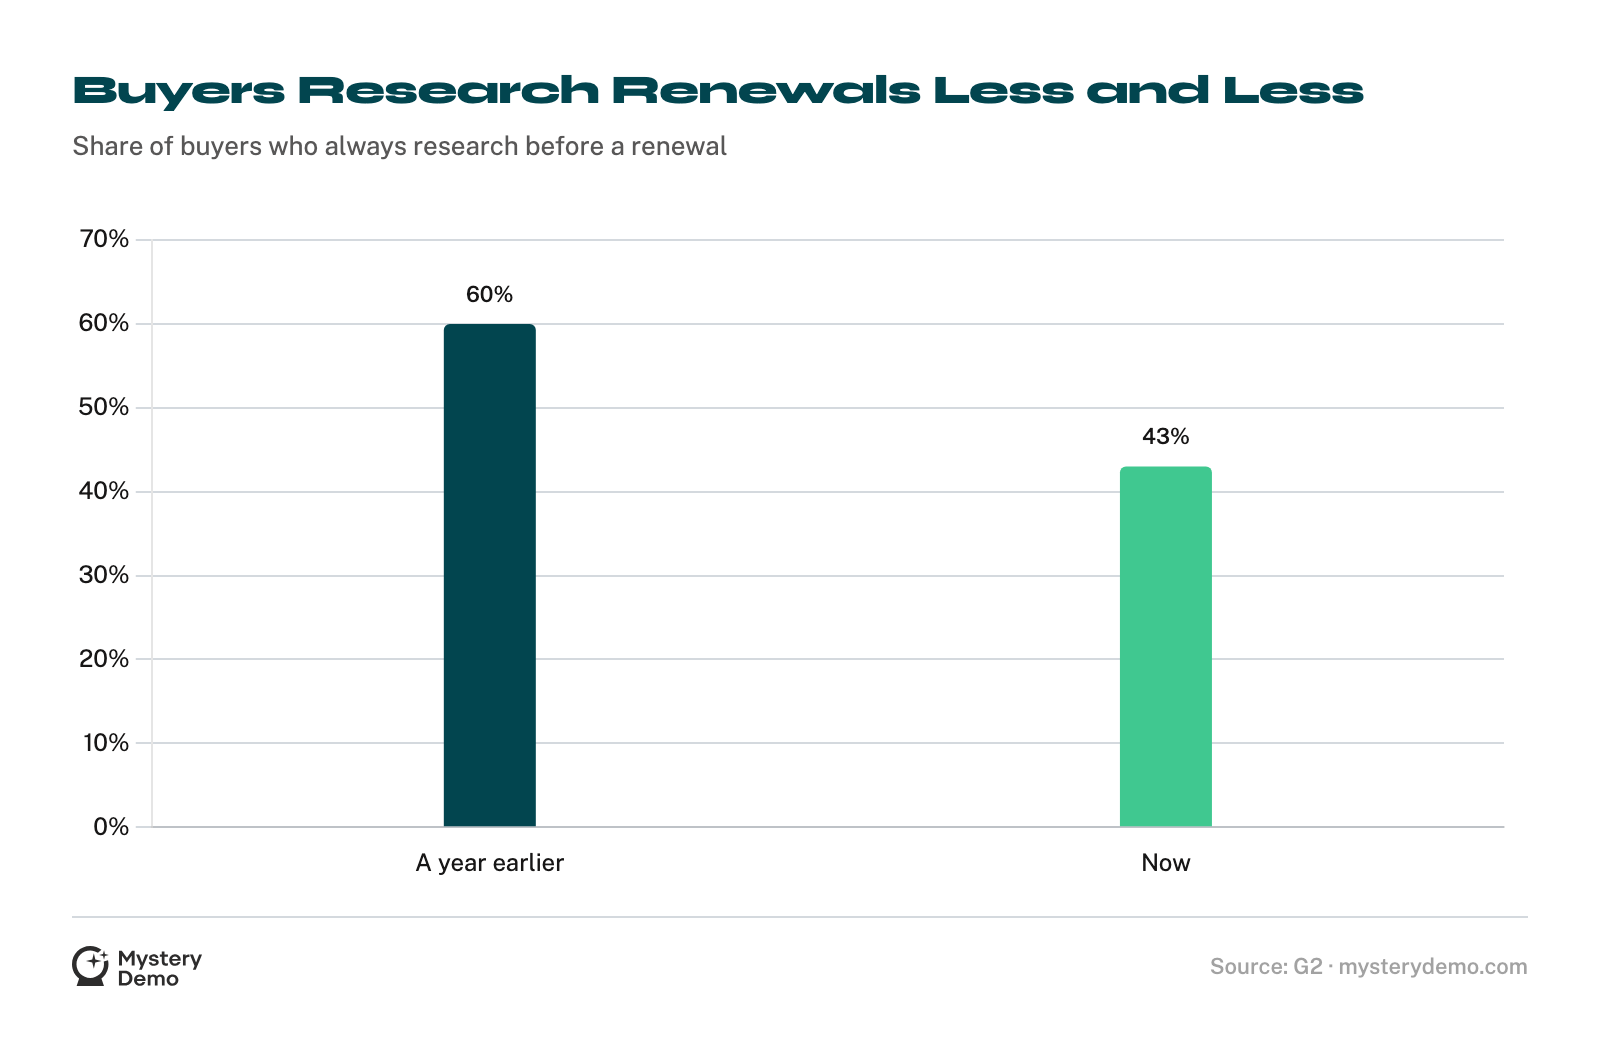
This is the central tension of displacement, and it cuts both ways. The incumbent’s defense is pure inertia: research-before-renewal dropped 17 points in a year, and most renewals are rubber-stamped.
But the wedge is sitting right next to it. 79% of IT leaders hit a price increase at renewal in the past year3, and only 38.1% treat renewals as a chance to cut costs3, so the grievance lands on a buyer who was not looking for it.
The challenger who shows up with the price increase already documented takes a customer who would otherwise have signed on autopilot.
.png)

Buyers Switch When the Incumbent Fails on Its Own Terms
The reasons a buyer replaces a vendor have little to do with the challenger’s pitch. They sit inside the incumbent’s own performance.
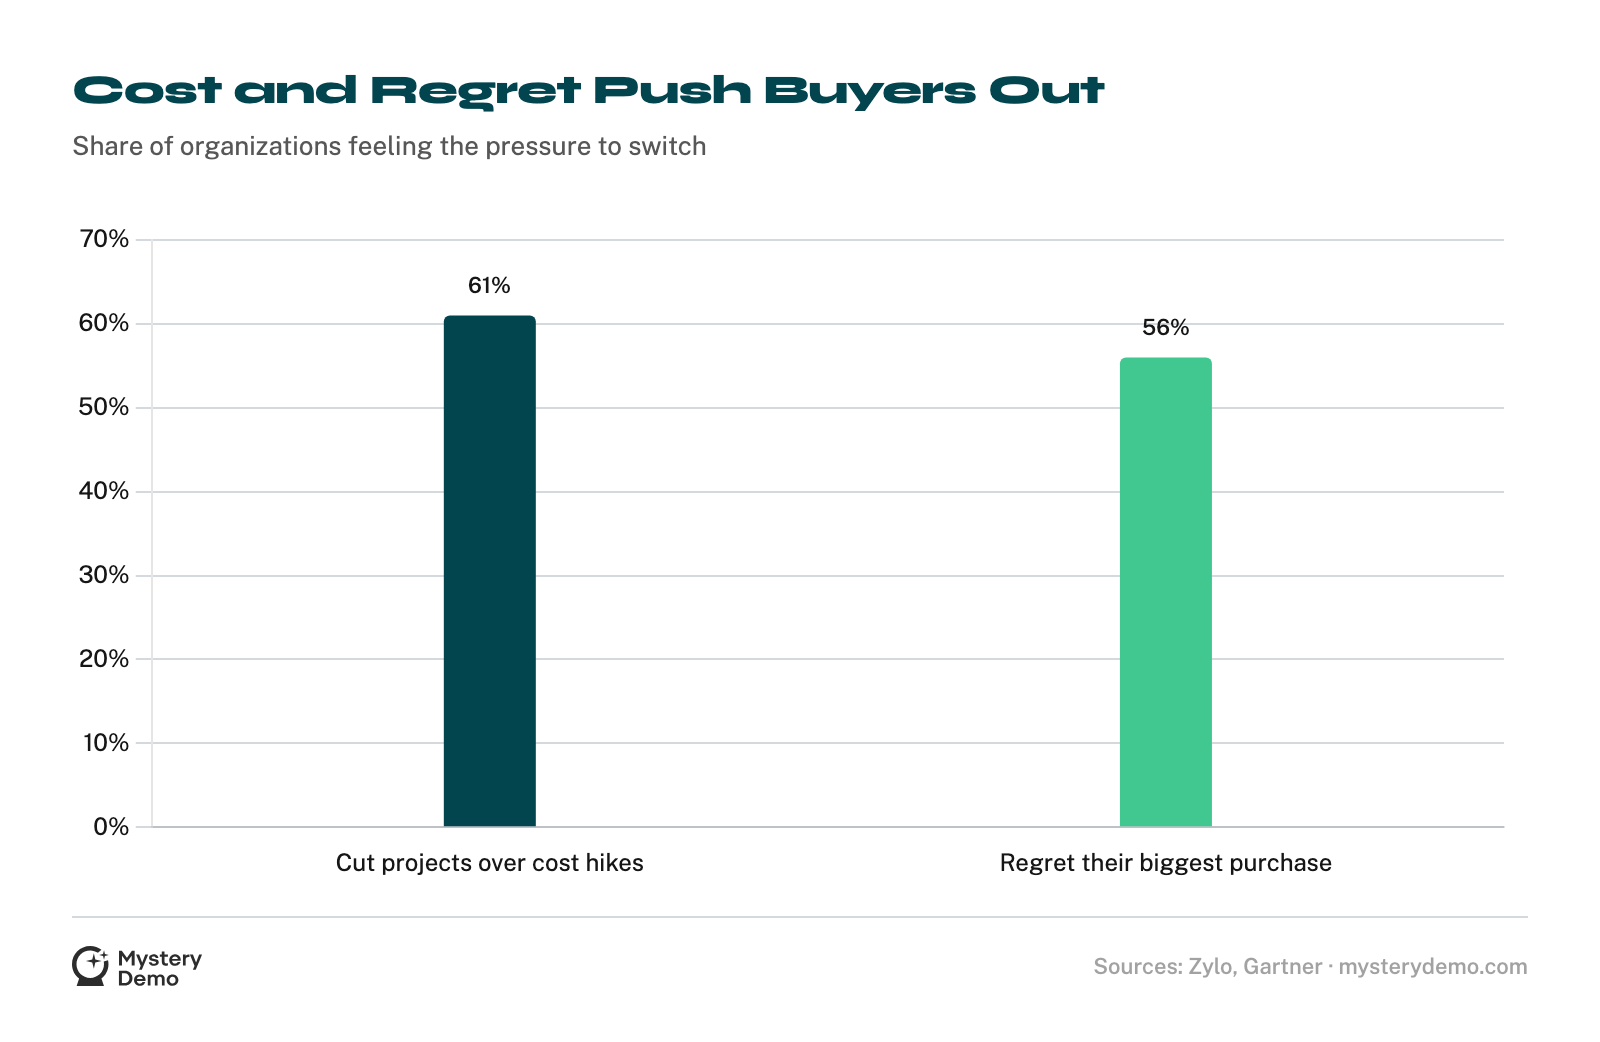
The switch triggers fall into two camps, and a challenger should know which one it is fishing in. The first is unmet value: productivity gaps and the new AI-capability gap, where nearly half of enterprise buyers already jumped ship for better features.
The second is pain: cost increases that kill projects and the 56% carrying a high degree of regret about their biggest purchase.
The regret figure is the quiet one to watch, because regret plus a 7-to-10-month-longer buying scar is a customer who is emotionally pre-sold on leaving and just needs a reason that feels safe.
The Waste That Sets Up the Switch
Underneath every displacement is a pile of software nobody uses and nobody is watching. It accumulates license by license, quietly, until it lands inside a renewal decision.
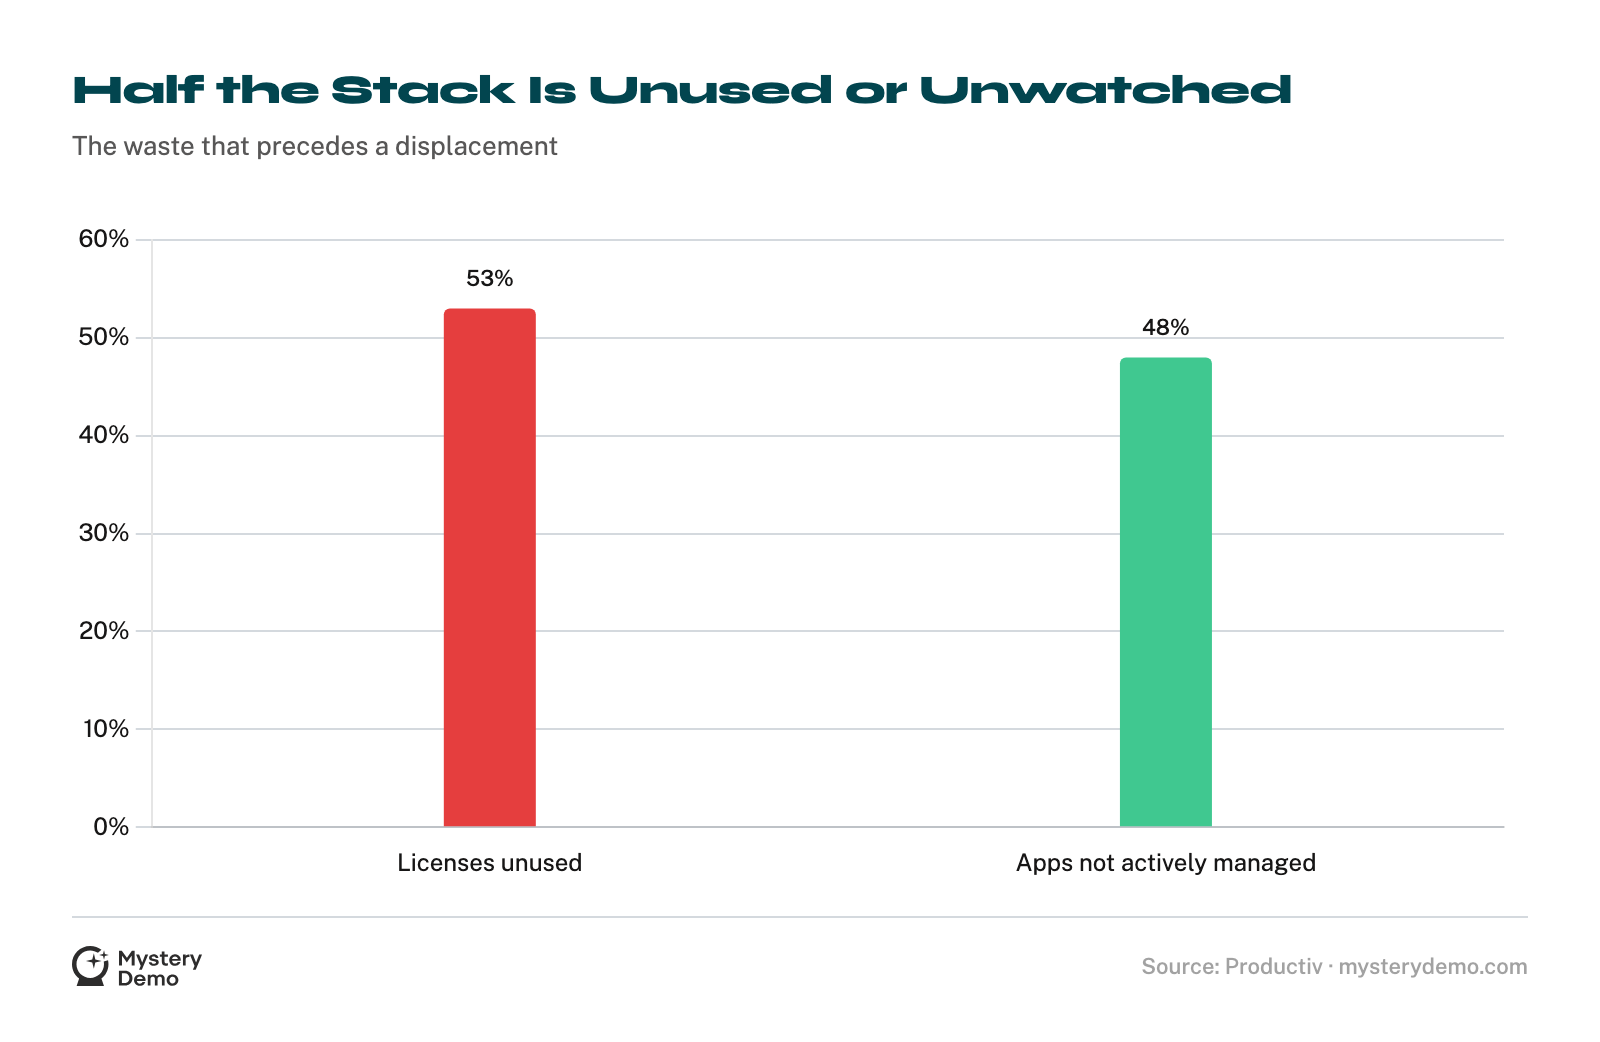
Two of these numbers explain why so much displacement is invisible until it happens.
Roughly half of every license base sits unused, and roughly half of the app stack has no one tracking its renewal date or usage, so the vendor most exposed to being cut is often the one with the least visibility into its own risk.
An app sitting at half-used licenses with nobody tracking its renewal date has stopped being a customer and become a line item waiting for a budget review. Pointing at that unused half gives the buyer a low-risk, defensible reason to move.
Buyers Are Consolidating and Incumbents Are Buying Time
The macro force accelerating all of this is consolidation. Buyers are actively pruning their stacks, and the apps that get pruned are the redundant, underused ones.
Consolidation and lock-in pull against each other. When a mid-sized company cuts its app count by 29%, every redundant tool is a displacement opportunity, and 63% of organizations name exactly the redundancy and budget pressure a challenger can point at as what drives consolidation6.
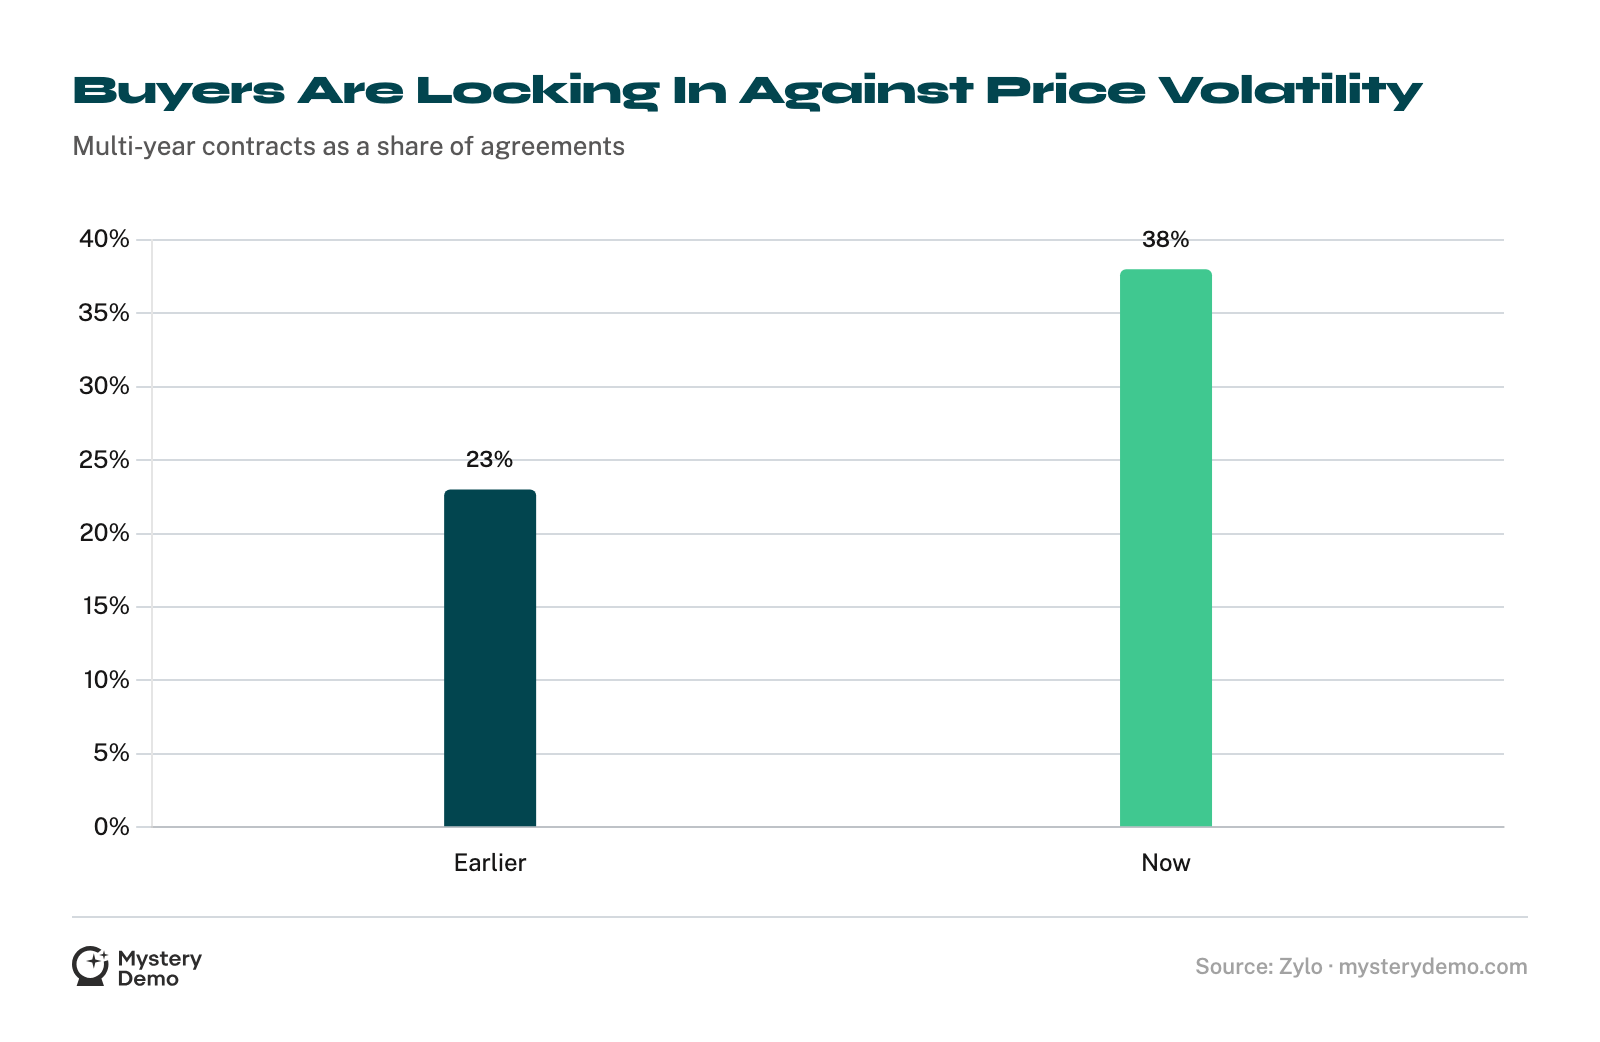
The incumbent’s counter is the multi-year contract, now 38% of agreements. Buyers are signing them to escape price volatility, even though the discount for committing longer has nearly vanished, which hands the incumbent a lock-in it did not have to earn.

The hard part of displacement is that the openings are invisible from the outside: a renewal price hike, a support queue gone cold, a half-used license. A feature page will never tell you any of it.
We book the incumbent’s demo and stay in the account long enough to hit their renewal cycle, so you get the number on the price-increase email, the ticket that sat a week without an answer, and the exact month their contract comes up for grabs.
For the full side-by-side, our competitor product comparison maps where they are genuinely beatable.
You have never seen the renewal conversation your prospect is having with their incumbent, and it is deciding your deal. Let us run that funnel and bring back the invoice, the switching objections, and the pressure that makes your case for you.
Frequently Asked Questions
How often do B2B SaaS customers switch vendors?
Constantly. The average SaaS portfolio has a 33% app churn rate, with a third of apps turning over in a year1, while median gross revenue retention has slipped to 88%, which works out to gross churn near 12%7.
What is the gross churn rate for B2B SaaS?
Median gross revenue retention has fallen from 90% to 88% over three years, which puts pure gross churn close to 12% before any expansion revenue is counted7.
Are some SaaS vendors really shrinking?
Yes. At $25K to $50K ACV, the bottom quartile of vendors sits at 97% net revenue retention, meaning a quarter are net-shrinking, losing more revenue than they expand8.
When does a SaaS customer most often switch?
At renewal. The average company handles 211 renewals a year2, and 79% of IT leaders faced a price increase at renewal in the past year, which is the moment the switch conversation starts3.
How strong is the incumbent advantage at renewal?
Strong, and built on inertia. The share of buyers who always research before a renewal fell from 60% to 43% in a year9, while only 38.1% treat renewals as a chance to cut costs3.
What triggers a B2B SaaS switch?
The top reason companies replace software is to improve productivity (26%), with cutting costs third (21%)9. A newer trigger is AI: nearly half of enterprise buyers switched providers for better AI features10.
Is AI now a reason companies switch software?
Increasingly, yes. Nearly half of enterprise buyers switched software providers in the past year specifically to gain better AI features10.
Do cost increases drive switching?
Heavily. 61% of organizations cut projects because of unplanned SaaS cost increases in the past year3, and renewal-time price hikes hit 79% of IT leaders3.
How common is buyer’s regret in SaaS purchases?
Very. 56% of organizations report high regret over their largest tech purchase of the past two years, and the high-regret deals took 7 to 10 months longer to complete11, leaving a customer primed to leave.
How much SaaS goes unused?
About half. 53% of licenses go unused, with only 47% used over a 90-day window4, and overall usage sits at 54%, equal to $19.8M in annual waste3.
Why is displacement so hard to see coming?
Because the stack is unwatched. 48% of enterprise apps are not actively managed, so nearly half the stack has no one tracking renewal dates or usage at the renew-or-replace decision5.
Are companies consolidating their SaaS stacks?
Yes. The average company ran 106 apps in 2024, down from 112 the year before, and mid-sized firms cut their app count 29% in 20256, while 63% of organizations name redundancy and budget pressure as what drives consolidation6.
Why are multi-year contracts rising?
Buyers are hedging. Multi-year contracts jumped from 23% to 38% of agreements as buyers lock in against price volatility, even though the discount for a longer commit has nearly disappeared3.
What does displacement data mean for competitive research?
It means the openings are inside the incumbent’s account, not on its website: a renewal hike, an unused license, a cold support queue. Finding them means sitting inside the account long enough to watch the renewal quote land and the support queue go cold.
How do you find where an incumbent is vulnerable?
We sign up for the incumbent’s trial and ride out their renewal cycle in the same engagement, then hand you the price movement, the ticket response times, and the multi-year terms they use to hold people in place, mapped against a full competitor product comparison.
References
- Zylo: SaaS Predictions for 2026, 2026 SaaS Management Index (2026)
- Zylo: Too Many Apps, 2026 SaaS Management Index (2026)
- Zylo: 2026 SaaS Pricing Trends, 2026 SaaS Management Index (2026)
- Productiv: 2023 State of SaaS Series (2023)
- Productiv: SaaS Statistics Every IT Manager Should See, State of SaaS (2024)
- BetterCloud: SaaS Statistics, State of SaaS Report (2025)
- Benchmarkit and Pavilion: 2025 B2B SaaS Performance Metrics Benchmarks (2025)
- SaaS Capital: What Is a Good Retention Rate for a Private SaaS Company in 2025 (2025)
- G2: 2024 Buyer Behavior Report (2024)
- G2: 2025 Buyer Behavior Report (2025)
- Gartner: Majority of Technology Purchases Come With High Degree of Regret (2022)
.png)


